Operations | Monitoring | ITSM | DevOps | Cloud

The latest News and Information on Monitoring for Websites, Applications, APIs, Infrastructure, and other technologies.

How to Reduce Duplicate Log Data with BindPlane OP

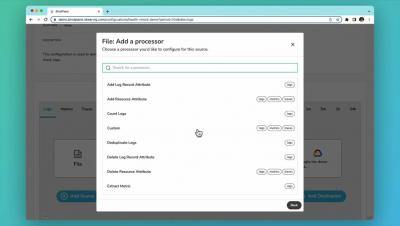
Are you dealing with duplicate log data? This can get expensive💰 and be difficult to parse, so how can one solve? Check out the clip with our CEO, Michael Kelly, as he shows you how to reduce telemetry data at the edge, reducing cost but not impacting visibility👀 with BindPlane OP. #telemetry #opensource #observability

Top Reasons to Embrace a Hybrid Multi-Cloud Strategy

It is not always possible or necessary for an organization to rely solely on cloud resources. For example, requirements might call for on-premises infrastructure for privacy reasons. Alternatively, some organizations might use both on-premises infrastructure and public cloud services provided by companies like AWS, Azure, or Google.

Expanding Our Vision: Unifying Client-Side Observability Data

In 2021, we started Request Metrics as a simple and developer-friendly service to measure and improve web performance. We built an incredible platform that distilled complex data down into simple reports and recommendations. Lots of teams around the world found valuable insights in Request Metrics that they couldn’t get anywhere else. But web performance data can be very unpredictable—the web slows down in all sorts of ways.

How to get started with monitoring Apache Cassandra with Grafana Cloud

Apache Cassandra is a highly scalable, open source NoSQL database system designed to handle large amounts of data across multiple commodity servers with no single point of failure. Apache Cassandra can be run as a single node but starts making sense when its run in a cluster setup. The system is optimized for high write throughput and is known for its ability to handle big data workloads with ease at super-low latencies.

The Complex Reality of Multi-Cloud Environments

Most companies today have multiple cloud instances with multiple cloud service providers (CSPs) as well as an on-premises environment. It’s complex, but that doesn’t make it inherently wrong—there are usually good business reasons behind the decisions. It does, however, create management challenges.

How to Measure Jitter & Keep Your Network Jitterbug Free

Has your network been bitten by the jitterbug? Are you tired of your network dancing the jitterbug? Do you find yourself constantly tapping your foot waiting for pages to load or downloads to finish? Network jitter is your network's biggest enemy when using unified communications and real-time apps like IP telephony, video conferencing, and virtual desktop infrastructure. Troubleshooting and measuring jitter helps you avoid sounding like a robot on video calls.

Cribl Reference Architecture Series: Scaling Effectively for a High Volume of Agents

Join Cribl’s Ed Bailey and Ahmed Kira in an insightful discussion about scaling your Cribl Stream architecture to accommodate a large number of agents. Managing high-volume agent data flows presents a unique set of challenges that must be addressed to ensure the reliable transmission of data from your endpoints to your analytics systems, meeting business resiliency requirements. Errors arising from agent scale and data volume can lead to difficult-to-diagnose and even more challenging-to-fix issues that tend to surface at the most inopportune times.

Set up application monitoring for your Node JS app in 20 mins with open source - SigNoz

In this article, learn how to setup application monitoring for Node.js apps with our open-source solution, SigNoz. Node.js tops the list of most widely used frameworks by developers. Powered by Google's V8 javascript engine, its performance is incredible. Ryan Dahl, the creator of Node.js, wanted to create real-time websites with push capability. On Nov 8, 2009, Node.js was first demonstrated by Dahl at the inaugural European JSconf.

10+ Best Tools & Systems for Monitoring Ubuntu Server Performance [2023 Comparison]

Ubuntu is a Linux distribution based on Debian Linux that’s mostly composed of open-source and free software. Released in three options – servers, desktop computers and Internet of Things devices. Ubuntu is highly popular, reliable and updated every 6 months, with a long-term support version released every two years. Multiple Ubuntu versions allow users to choose whether to stick with the long-term support version or the recently updated one.

Introduction to Prefix Featuring OpenTelemetry

Prefix puts the power of OpenTelemetry in the hands of developers, supercharging performance optimization for your entire DevOps team. With unmatched observability across user environments, new technologies, frameworks and architectures, Prefix simplifies every step in code development, app creation and ongoing performance optimization for your apps and your team!