Operations | Monitoring | ITSM | DevOps | Cloud

Monitoring

The latest News and Information on Monitoring for Websites, Applications, APIs, Infrastructure, and other technologies.

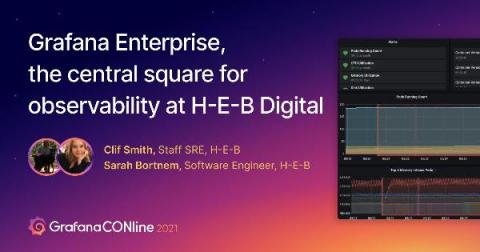
How grocery chain H-E-B uses the Grafana Enterprise Stack to improve business

H-E-B is one of the largest grocery chains in the U.S. that works with roughly 137,000 partners to achieve more than $32 billion in sales each year. In the past decade, the 116-year-old, Texas-based grocer has undergone a digital transformation to reinvent and expand its business, offering services such as online bakery orders, curbside pick-up, and grocery delivery from its 420 stores.

The State of IT Operations Management in 2021

It's all changing! So, business as usual! Working flexibly from home quarantine these past two years has brought a few things into sharper focus. For a start, there's really no such thing as an IT system---there are only Human-IT systems. IT isn't an accessory, it's an integral part of us. Multiple tech cultures are playing a larger role in decision making. Technology decisions are becoming more distributed and more market-driven, from the bottom up rather than exclusively from the top down.

How to Use Observability to Reduce MTTR

When you’re operating a web application, the last thing you want to hear is “the site is down." Regardless of the reason, the fact that it is down is enough to cause anyone responsible for an app to break out into a sweat. As soon as you become aware of an issue, a clock starts ticking — literally, in some cases — to get the issue fixed. Minimizing this time between an issue occurring and its resolution is arguably the number one goal for any operations team.

DataDog Competitors: 9 Alternatives to Consider

DataDog is a service that monitors cloud-scale applications. It is a platform used by developers of various information technology (IT) and DevOps teams. Through this service, they can define and regulate performance metrics. It was first developed in 2010 in New York by Oliver Pomel and Alexis Lê-Quôc, the current CEO and CTO, respectively.

Monitoring Availability Metrics with Blackbox exporter and Sysdig

The Prometheus Blackbox exporter allows endpoints exploration over several protocols, such as HTTP(S), DNS, TCP, and ICMP. This exporter generates multiple metrics on your configured targets, like general endpoint status, response time, redirect information, or certificate expiration dates. The Blackbox Exporter works out-of-the-box, as it just focuses on external visibility details. To get more detailed metrics, you can instrument your applications.

The Importance of Log Management for Your Home Network

The team at observIQ is just like every one of you reading this, we are avid programmers, gamers, traders, thinkers, and innovators who build an elaborate home network for fun, work, and for the simple reason that we enjoy technology. We are constantly growing the size and footprint of our home networks and labs as well – adding custom apps, devices, and servers, making it challenging to gauge our technical footprint.

How Log Analytics Powers Cloud Operations: Three Best Practices for CloudOps Engineers

At the turn of the 20th Century, enterprises shut down their clunky generators and started buying electricity from new utilities such as the Edison Illuminating Company. In doing so, they cut costs, simplified operations, and made profound leaps in productivity. The promise of modern cloud computing invites easy comparisons to those first electric utilities: outsource to them, save money and simplify.