Operations | Monitoring | ITSM | DevOps | Cloud
Monitoring
The latest News and Information on Monitoring for Websites, Applications, APIs, Infrastructure, and other technologies.
Use Suspect Tags to improve App Performance
When you’re trying to optimize your application for performance, it helps to understand not only the number of people affected, but also user conditions of the slowest transactions, such as OS, browser type, and even connection type. When you’re looking at performance data, it can be hard to see the forest through the trees.
Announcing support for EKS Anywhere
Amazon Elastic Kubernetes Service (EKS) is a cloud-based compute platform that includes a fully managed Kubernetes control plane in order to simplify cluster operations. AWS introduced EKS Anywhere to bring the operational ease of EKS to organizations that manage on-premise environments (e.g., to meet data sovereignty requirements).
Monitor your Netlify sites with Datadog
Netlify is a Jamstack web development platform that lets customers build and deploy dynamic, highly performant web apps. By uniting popular JavaScript frameworks, developer tools, and APIs into streamlined workflows, Netlify helps teams rapidly spin up and ship common Jamstack use cases, including e-commerce stores, SaaS applications, and corporate sites. Netlify supports these deployments with an integrated CI/CD tool, global multi-cloud edge network, and serverless backend.
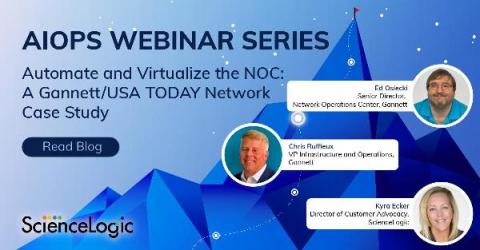
Automate and Virtualize the NOC: A Gannett/USA TODAY Network Case Study
Mission creep is a phenomenon that occurs after a project begins and gains momentum, but then gradually grows beyond the original, intended scope. One day you wake up and realize that, instead of an efficient, manageable project, you’ve got a monster on your hands. For enterprises in the midst of dynamic growth, IT infrastructure is often beset by mission creep. The incumbent organization acquires smaller operations, integrates their technology, and soon things are out of control.
How to Clear Up Alert Storms by 90%?
Alerts are notifications from AIOps monitoring tools that indicate that there is an anomaly. IT teams get these alerts on their monitoring dashboard via emails or enterprise collaboration tools such as Slack or Teams. Service level agreements expect IT teams to analyze every alert within a specific timeframe and take appropriate action.
Monitoring Physical Security With Graylog final
Using MQ Statistics with Nastel Navigator X
How to Control Alert Fatigue?
Alerts are indispensable to any IT operations system today. Site reliability engineers (SREs) or ITOps executives set up several monitoring tools for their IT landscape. When there is a change, high-risk action, or outage in any of these incidents, the monitoring tool triggers an automated alert. This could happen on the monitoring tool’s dashboard itself, via email, or enterprise collaboration tools like Slack or Teams.


