Operations | Monitoring | ITSM | DevOps | Cloud

Monitoring

The latest News and Information on Monitoring for Websites, Applications, APIs, Infrastructure, and other technologies.

How Streamlining ITSM Operations Can Reduce Service Remediation Costs

When using Microsoft 365 services the main benefit of having a monitoring tool that can assess performance quality and identify issues is that it sends alerts into a ticketing tool such as ServiceNow for example, to initiate the process of remediating the problem. When you don’t have a monitoring tool in place then support tickets aren’t automatically sent and users must identify issues and send in tickets manually with little to no information on where the problem came from.

Data Lakes Are Gaining Maturity, According to 2021 Gartner Hype Cycle for Data Management

IT leaders’ experiences with data lakes have been a roller coaster ride since their inception in 2010. To some, that roller coaster ride might resemble the canonical Hype Cycle graphic, trademarked by Gartner to show the maturity curve of technologies in a given category over time. This year’s Hype Cycle for Data Management report was just released, revealing that modern data lakes are poised to exit the Trough of Disillusionment and enter the Slope of Enlightenment in 2022.

Why SQL Server Monitoring Is the First Step in Improving Performance

SQL Server monitoring is continuous collection and analysis of usage, performance, and event metrics for Microsoft SQL Server. It’s the first step in optimizing performance for applications that depend on your data platform. Highly effective monitoring gives a bird’s-eye view of your entire data estate. It also provides the deep analytics necessary to perform root cause analysis on the most challenging performance problems.

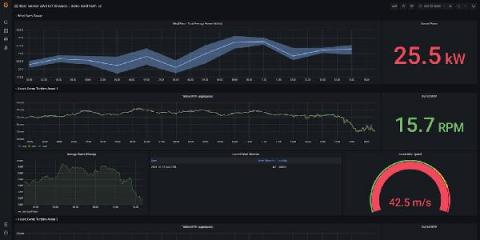
How to use AWS IoT SiteWise Edge and Grafana to collect and monitor industrial data on-premises

The AWS IoT SiteWise plugin for Grafana was created to enable AWS IoT SiteWise customers to visualize and monitor industrial equipment data using Grafana dashboards. Industrial customers use AWS IoT SiteWise to collect, process, and monitor their industrial data at scale. This plugin allows them to use Grafana dashboards to monitor this data, stored by AWS IoT SiteWise in the AWS Cloud.

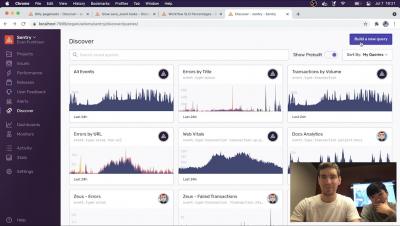
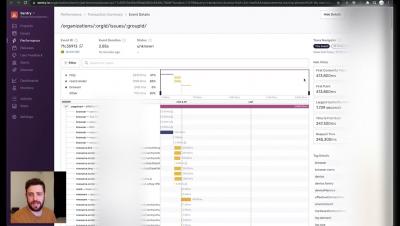
Use Suspect Tags to improve App Performance

When you’re trying to optimize your application for performance, it helps to understand not only the number of people affected, but also user conditions of the slowest transactions, such as OS, browser type, and even connection type. When you’re looking at performance data, it can be hard to see the forest through the trees.

What is IT Automation?

Sogeti, a Managed Service Provider (MSP) that provides tech and engineering resources worldwide, had a crucial IT challenge to solve. The MSP operates in more than 100 locations globally and was using six different monitoring tools to monitor its customers’ environments. It was a classic example of tool sprawl and needing to scale where multiple teams of engineers relied on too many disparate tools to manage their customers’ environments.