Operations | Monitoring | ITSM | DevOps | Cloud

Monitoring

The latest News and Information on Monitoring for Websites, Applications, APIs, Infrastructure, and other technologies.

Getting Started with OpenTelemetry and VMware Tanzu Observability

Modern application architectures are complex, typically consisting of hundreds of distributed microservices implemented in different languages and by different teams. As a developer, SRE, or DevOps engineer, you are responsible for the reliability and performance of these complex systems. But while you might have metrics that will help you debug when there’s an issue, metrics alone can’t help you narrow down and ultimately identify the root cause.

3 Ways to Improve DataPower Performance

IBM DataPower Gateway is the latest variant of DataPower and helps organizations meet the security and integration needs of a digital business in a single multi-channel gateway. It provides security, control, integration and optimized access to a full range of mobile, web, application programming interface (API), serviceoriented architecture (SOA), B2B and cloud workloads.

Build Vs. Buy Discussion

This a complex question with deep implications that touch many areas of the business including the executive team, finance, procurement and Human Resources. In this short webinar we will discuss some of the areas that must be considered and provide you with some strategic ideas to improve your business. This presentation is gleaned from the hundreds of man-years of experience our experts have had in answering this exact question.

Comparing gRPC performance across different technologies

gRPC is an open-source Remote Procedure Call system focusing on high performance. There exist several gRPC benchmarks including an official one, yet we still wanted to create our own. Why would we torture ourselves doing such a thing? So with those points in mind, we created a completely open-source benchmark where everyone is welcome to contribute and which could be run with a single command, having only Docker as a prerequisite.

How we use Grafana and Prometheus to monitor the traffic of our many GitHub repositories

If you want to understand the popularity of your GitHub repositories, knowing the number of stars isn’t enough. GitHub understands this, and that’s why the team released traffic insights. Anyone with push access to a repository can view these insights, which include: full clones, visitors from the past 14 days, referring sites, and popular content in the traffic graph.

Splunk Delivers Real-Time Salesforce Visibility with New Streaming API Integration

You might already be using Splunk to manage your Salesforce environment with the help of the Splunk App for Salesforce and the Splunk Add-on for Salesforce that allows a Splunk administrator to collect different types of data from Salesforce using REST APIs. This solution is great and the events give you an idea of how users interact with Salesforce. These events can range from Apex executions to page views.

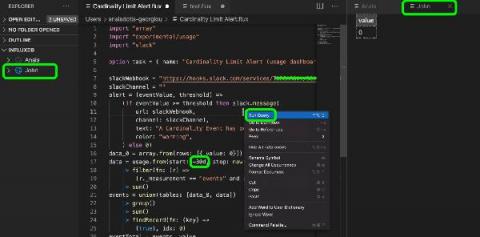
Using the Flux VS Code Extension for IoT Application Development

InfluxData prides itself on its effort to prioritize developer happiness. This included providing developers with a variety of tools to interact with InfluxDB v2 OSS or InfluxDB Cloud, so they can pick the development style that works best for them. This article assumes you’re using the InfluxDB Cloud Free tier, which is the easiest way to get started and maintain InfluxDB. You can use any of the following tools for your IoT application development.

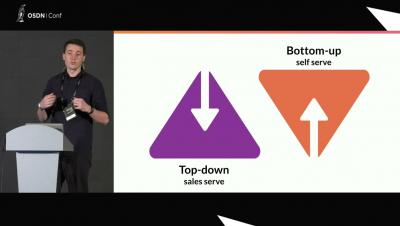
Roman Khavronenko | Open-source strategy at VictoriaMetrics

Building a company around free software product is not something new. What's less common is creating a company in order to build a free software product. This talk will cover our story of creating time series database, the lessons we learned, the mistakes we made. The free software world has changed over the last years. The one thing remains essential - importance of community, people who use the product.

The More You Monitor: What Are the Three Pillars of Observability?

A common way to discuss observability is to break it down into three types of telemetry: metrics, traces, and logs. These three data points are often referred to as the three pillars of observability. In this episode of The More You Monitor Product Manager, Chris Sternberg, breaks down the three pillars of observability and how they can help you gain better control and visibility of your infrastructure, applications, and networks. It’s important to remember that although these pillars are key to achieving observability, they are only the telemetry and not the end result.

Understanding Managed Service Providers (MSPs) and What They Do

The field of information technology has advanced at a breakneck pace in the last 20 years. Hence, it has become imperative for any business to know and adopt technologies that can make them productive and more competent at the same time. However, not all firms have the resources to expand their team of IT professionals for several reasons, particularly within small and medium-sized businesses.