Operations | Monitoring | ITSM | DevOps | Cloud

Monitoring

The latest News and Information on Monitoring for Websites, Applications, APIs, Infrastructure, and other technologies.

NECA delivers 99.9% system uptime using Applications Manager

NECA is an allied association of local telecommunications providers in the United States that was instituted by the Federal Communications Commission. It aims to provide rural consumers across the country with telecommunications and broadband services at affordable prices. Its services also include economic forecasting, trend analysis, industry database management, and rate and tariff analysis.

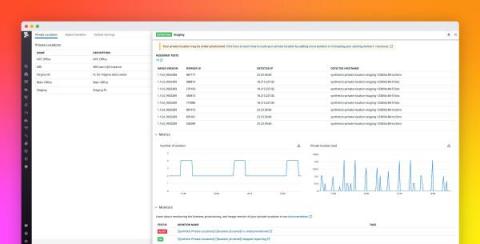
Monitor your Synthetic private locations with Datadog

Datadog Synthetic private locations play a key role in your organization’s test infrastructure by serving as highly customizable points of presence (e.g., data centers, geographic locations) for running synthetic tests on internal services. You can deploy private locations using the orchestrator of your choice, enabling you to seamlessly roll them out and scale them with the rest of your container fleet.

Ask Miss O11y: Mapping Out Your Observability Journey

Dear Trapped, Thanks for asking the question! Approaching observability as an all-or-nothing problem often leads to the project feeling daunting. But that’s not specific to observability—any project can be overwhelming if you think it needs to be done all at once, perfectly. Such as, erm, writing an entire book on observability! *looks around worriedly*

Windows Event Log Best Practices for Operations Teams

The Windows Event log is an essential tool for administrators to investigate and diagnose potential system issues, but it can also be a daunting task to gain real value and separate useful log entries from noisy non-essential activity. Depending on the level of logging that can be useful, Windows events can span system issues, application-specific issues, and also dive into security type issues around unauthorized access, login failures, and unusual behavior.

WFA: Visible - Digital Experience Index (DXI) Dashboard

If you’re not sure where to start when prioritizing investments that will have the greatest impact on user experience, this dashboard is for you! Teneo’s WFA: Visible DXI Dashboard allows you to be 5 times faster at prioritizing objectives, identifying what to improve, and reporting on improvement. #TeneoGrp

Development Environment Observability with Sentry

At Sentry, we’re always looking for innovative ways to dogfood our product. Over the last year we added Sentry’s error monitoring to our developer environment so that we could better understand the health of it. In this blog post I’m going to touch on how fragile local development environments can be, how we brought observability into what’s happening by introducing Sentry, and what outcomes it has driven for our engineering organization.

Challenges maintaining Prometheus LTS

In this article, we’ll cover the three main challenges you may face when maintaining your own Prometheus LTS solution. In the beginning, Prometheus claimed that it wasn’t a long-term metrics storage, the expected outcome was that somebody would eventually create that long-term storage (LTS) for Prometheus metrics. Currently, there are several open-source projects to provide long-term storage (Prometheus LTS). These community projects are ahead of the rest: Cortex, Thanos, and M3.