Sentry vs Crashlytics: Deep Dive & Live Demo
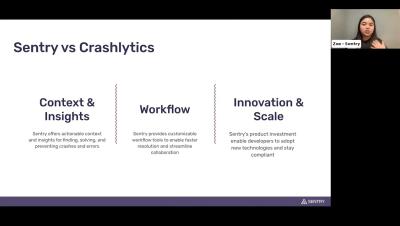
We get a lot of questions from mobile developers about the difference between Sentry and Firebase Crashlytics, a lightweight crash reporting tool. In this workshop, we provided all the details you need to know to make an informed decision.