Operations | Monitoring | ITSM | DevOps | Cloud

The latest News and Information on Monitoring for Websites, Applications, APIs, Infrastructure, and other technologies.

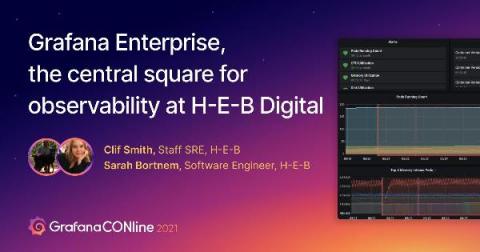
How grocery chain H-E-B uses the Grafana Enterprise Stack to improve business

H-E-B is one of the largest grocery chains in the U.S. that works with roughly 137,000 partners to achieve more than $32 billion in sales each year. In the past decade, the 116-year-old, Texas-based grocer has undergone a digital transformation to reinvent and expand its business, offering services such as online bakery orders, curbside pick-up, and grocery delivery from its 420 stores.

DataDog Competitors: 9 Alternatives to Consider

DataDog is a service that monitors cloud-scale applications. It is a platform used by developers of various information technology (IT) and DevOps teams. Through this service, they can define and regulate performance metrics. It was first developed in 2010 in New York by Oliver Pomel and Alexis Lê-Quôc, the current CEO and CTO, respectively.

Monitoring Availability Metrics with Blackbox exporter and Sysdig

The Prometheus Blackbox exporter allows endpoints exploration over several protocols, such as HTTP(S), DNS, TCP, and ICMP. This exporter generates multiple metrics on your configured targets, like general endpoint status, response time, redirect information, or certificate expiration dates. The Blackbox Exporter works out-of-the-box, as it just focuses on external visibility details. To get more detailed metrics, you can instrument your applications.

The Importance of Log Management for Your Home Network

The team at observIQ is just like every one of you reading this, we are avid programmers, gamers, traders, thinkers, and innovators who build an elaborate home network for fun, work, and for the simple reason that we enjoy technology. We are constantly growing the size and footprint of our home networks and labs as well – adding custom apps, devices, and servers, making it challenging to gauge our technical footprint.

Connection Center for ServiceNow Deep Dive

Take a deep dive into our SCOM Connection Center for ServiceNow. Discover how to convert critical SCOM alerts into actionable ServiceNow incidents with real-time, two-way synchronization. Plus, find out how we use out-of-the-box, code-free integration to get SCOM and ServiceNow working as one! You can download a FREE 30-DAY TRIAL on our website.

A Riddle, a Sale, and the Importance of Proactive End-User Monitoring

Finally, the days are getting longer, the sun is heating up, and I’m able to spend all my free time outside soaking it in here in Austin, Texas. As I was laying out this weekend, I came up with a riddle for you: what do sunscreen, a life vest, and SolarWinds® Pingdom® have in common? Whether it’s real or metaphorical crickets I’m hearing, here’s the answer: proactivity.

Designing Honeycomb for Our Users

You might have noticed some visual changes happening in Honeycomb lately. Colors, typography, icons, and some features have started to look a bit different. While these changes are just beginning to make their way into the product, we’ve been working on them for some time. Let’s look at what has been going on behind the scenes to make them happen.