Operations | Monitoring | ITSM | DevOps | Cloud

The latest News and Information on Monitoring for Websites, Applications, APIs, Infrastructure, and other technologies.

5 Most Common API Errors and How to Fix Them

As software got more complex, more and more software projects rely on API integrations to run. Some of the most common API use cases involve pulling in external data that’s crucial to the function of your application. This includes weather data, financial data, or even syncing with another service your customer wants to share data with. However, the risk with API development lies in the interaction with code you didn’t write—and usually cannot see—that needs debugging.
Rollbar Tip of the Day: Linking to AWS CloudWatch logs from Rollbar

Learn how to link to log data in AWS CloudWatch from Rollbar to help you quickly understand the root cause of an error. Rollbar is the leading continuous code improvement platform that proactively discovers, predicts, and remediates errors with real-time AI-assisted workflows. With Rollbar, developers continually improve their code and constantly innovate rather than spending time monitoring, investigating, and debugging.

Tale of the Beagle (Or It Doesn't Scale-Except When It Does)

If there’s one thing folks working in internet services love saying, it’s: "Yeah, sure, but that won’t scale." It’s an easy complaint to make, but in this post, we’ll walk through building a service using an approach that doesn’t scale in order to learn more about the problem. (And in the process, discovering that it actually did scale much longer than one would expect.)

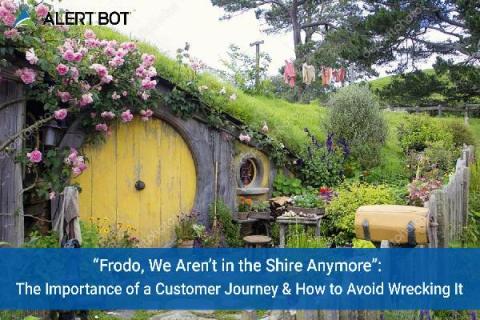
"Frodo, We Aren't in the Shire Anymore": The Importance of a Customer Journey & How to Avoid Wrecking It

“Frodo, We Aren’t in the Shire Anymore”: The Importance of a Customer Journey & How to Avoid Wrecking It Fans of Lord of the Rings — otherwise known as “Ringers” — never grow weary of reading or watching Frodo and his fellow Hobbits journey through Middle Earth on an epic quest to Mordor (where rumor has it there now exists a very stylish Starbucks at the base of Mount Doom). Well, customers who visit a website are on an important journey as well.

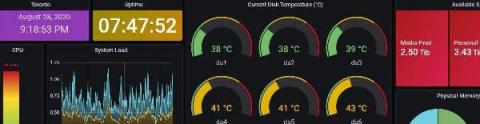
The Top 21 Grafana Dashboards & Visualisations

In our guide on the best Grafana dashboards examples, we wanted to show you some of the best ways you can use Grafana for a variety of different use cases across your organisation. Whether you are a software architect or a lead DevOps engineer, Grafana is used to make analysis and data visualisation far easier to conduct for busy engineering and technical teams throughout the world.

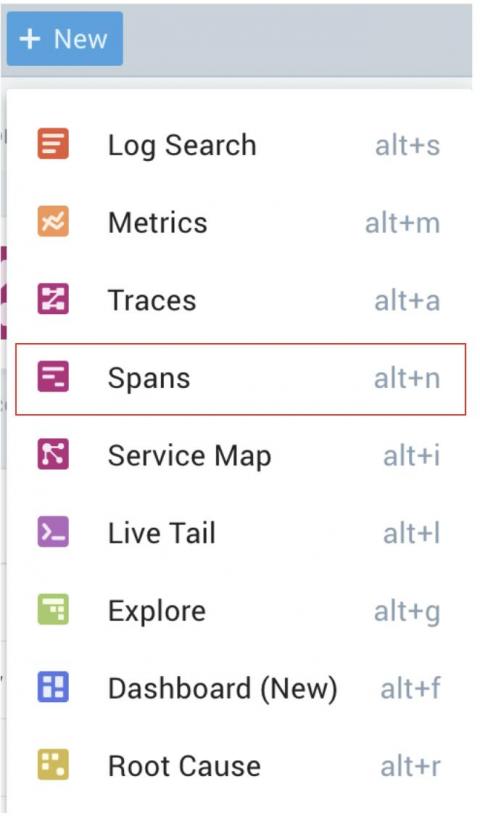
Queryless vs. Query-less. Faster Insights and Better Observer Experience with Span Analytics

In one of my previous blogs I explained how important it is for a modern observability platform to provide “the observers” full, flexible access to all raw telemetry. Observability’s promise to find unknown unknowns relied directly on the ability of fast, powerful and multidimensional high-cardinality analysis of raw data, to uncover previously unknown patterns that have not yet been visualized as a metric, dashboard panel or an alert or anomaly event.

Announcing the GA of the LogDNA Configuration API and LogDNA Terraform Provider

We’re excited to announce that our Configuration API and Terraform Provider are now generally available for all LogDNA customers. We received tremendous feedback from our public beta release and, based on that feedback, we are enabling several new features with the GA release that allow for more programmatic workflows with LogDNA. First, we are enabling Preset Alerts as a new resource that can be configured with the configuration API as well as within Terraform.

Boosting performance with network monitoring solutions

Technological advances and emerging networking concepts are constantly shaping our IT infrastructure. Networks are no longer limited to traditional networking constraints such as its static nature, but are continually evolving to improve efficiency by spanning across wired, wireless, virtual, and hybrid IT environments. This IT evolution drives organizations to advance digitally and support computational requirements to meet their business objectives.

Use Datadog Session Replay to view real-time user journeys

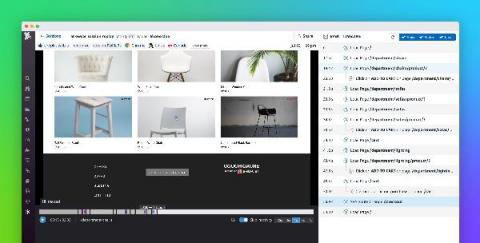
When developing large, customer-facing applications, it’s paramount to have visibility into real user behavior in order to optimize your UX. Without a direct view into what users are actually doing when navigating your app, it can be difficult to reproduce bugs and understand how aspects of your frontend design are causing user frustration and churn. With Datadog RUM’s Session Replay feature, currently available in beta, you can watch individual user sessions using a video-like interface.