Operations | Monitoring | ITSM | DevOps | Cloud

The latest News and Information on Monitoring for Websites, Applications, APIs, Infrastructure, and other technologies.

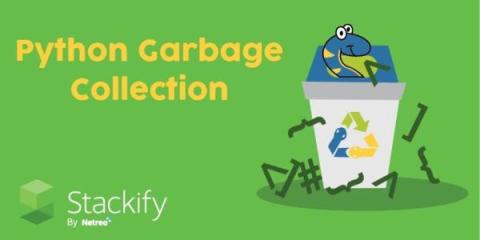
Python Garbage Collection: What It Is and How It Works

Python is one of the most popular programming languages and its usage continues to grow. It ranked first in the TIOBE language of the year in 2022 and 2023 due to its growth rate. Python’s ease of use and large community have made it a popular fit for data analysis, web applications, and task automation. In this post, we’ll cover: We’ll take a practical look at how you should think about garbage collection when writing your Python applications.
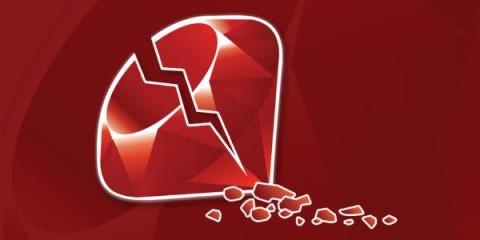

How to Rescue Exceptions in Ruby

Exceptions are a commonly used feature in the Ruby programming language. The Ruby standard library defines about 30 different subclasses of exceptions, some of which have their own subclasses. The exception mechanism in Ruby is very powerful but often misused. This article will discuss the use of exceptions and show some examples of how to deal with them.

How Mobile Apps for Website Monitoring Can Improve User Experience

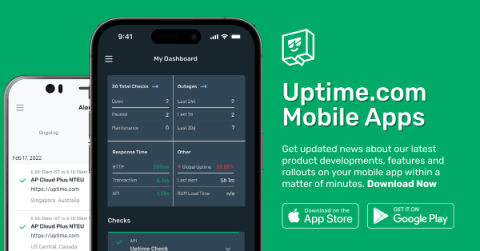
Imagine being on a relaxing vacation, the waves lapping at your feet, a drink in hand, and then you hear a gentle ping from your phone. Uh oh… what now? This alert is not an annoying email or a distracting message, but a digital fire alarm informing you that your website is down. Vacation time is over—time to find your laptop and some Wi-Fi.

Monitoring Kubernetes tutorial: Using Grafana and Prometheus

Behind the trends of cloud-native architectures and microservices lies a technical complexity, a paradigm shift, and a rugged learning curve. This complexity manifests itself in the design, deployment, and security, as well as everything that concerns the monitoring and observability of applications running in distributed systems like Kubernetes. Fortunately, there are tools to help developers overcome these obstacles.

Graphite vs Prometheus

Graphite and Prometheus are both great tools for monitoring networks, servers, other infrastructure, and applications. Both Graphite and Prometheus are what we call time-series monitoring systems, meaning they both focus on monitoring metrics that record data points over time. At MetricFire we offer a hosted version of Graphite, so our users can try it out on our free trial and see which works better in their case.

LogicMonitor Excels in G2 Fall 2023 Network Monitoring Report

Fall 2023 Reports, including Enterprise Monitoring and Cloud Infrastructure Monitoring, were announced September 12, 2023 from G2, the world’s leading business software review platform. Take a look inside the G2 Fall 2023 Network Monitoring Report highlights below to see where LogicMonitor stood out among the rest.