The latest News and Information on Monitoring for Websites, Applications, APIs, Infrastructure, and other technologies.
Our industry is in the early days of an explosion in software using LLMs, as well as (separately, but relatedly) a revolution in how engineers write and run code, thanks to generative AI. Many software engineers are encountering LLMs for the very first time, while many ML engineers are being exposed directly to production systems for the very first time.
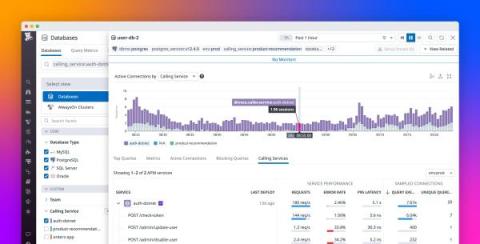
When the services in your distributed application interact with a database, you need telemetry that gives you end-to-end visibility into query performance to troubleshoot application issues. But often there are obstacles: application developers don’t have visibility into the database or its infrastructure, and database administrators (DBAs) can’t attribute the database load to specific services.
Logz.io is thrilled to have earned over 20 Fall 2023 G2 Badges for our Logz.io Open 360™ essential observability platform! G2 Research is a tech marketplace where people can discover, review, and manage the software they need to reach their potential. We’ve earned the following Fall 2023 G2 Badges for Application Performance Monitoring (APM) and Log Analysis.
X-ray machines are one of the most sophisticated tools in the medical field. Capable of creating images of someone’s fractured arm, x-rays enable medical professionals to see what is going on in a patient’s most vital areas. In the IT world, server monitoring has a similar function.
Application performance monitoring (APM) tools have become a fundamental part of many organisations that wish to track and observe the optimal functioning of their web-based applications. These tools serve to greatly simplify the process through automation and allow teams to effectively collaborate to maximize efficiency, enabling you to reach the root cause of an issue before it reaches your customers.
Picture this: You're knee-deep in the intricacies of a complex Kubernetes deployment, dealing with a web of services and resources that seem like a tangled ball of string. Visualization feels like an impossible dream, and understanding the interactions between resources? Well, that's another story. Meanwhile, your inbox is overflowing with alert emails, your Slack is buzzing with queries from the business side, and all you really want to do is figure out where the glitch is. Stressful? You bet!
Today we are going to touch up on the topic of why Graphite monitoring is essential. In today’s current climate of extreme competition, service reliability is crucial to the success of a business. Any downtime or degraded user experience is simply not an option as dissatisfied customers will jump ship in an instant. Operations teams must be able to monitor their systems organically, paying particular attention to Service Level Indicators (SLIs) pertaining to the availability of the system.
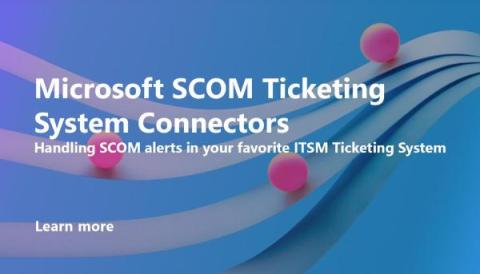
SCOM (System Center Operations Manager) is a powerful tool that allows experts to monitor and manage their IT environment. However, to make the most out of SCOM, choosing a suitable ITSM connector that integrates with your existing ticketing systems is essential. In this blog post, we will explore different SCOM connectors available in the market and compare their features to help you make an informed decision.