Operations | Monitoring | ITSM | DevOps | Cloud

The latest News and Information on Monitoring for Websites, Applications, APIs, Infrastructure, and other technologies.

Top 10 Digital Experience Monitoring Tools in 2026

Server dashboards can look healthy while users wait. Only 51% of the 1,000 most popular mobile sites pass Core Web Vitals, according to the HTTP Archive's 2025 Web Almanac. Closing that gap is the job of digital experience monitoring tools. Some watch customers on your website and mobile apps, others watch staff on laptops and virtual desktops, and a third watches the network in between. Pick the wrong type and you lose a review cycle.

10 Best Real User Monitoring Tools Compared for 2026

Most IT teams learn their application feels slow when a customer complains. Server metrics never measure what a person on a phone waits for. The best real user monitoring tools close that gap by collecting timings from your users' browsers. Choosing one got harder this year, because the measurement standard moved. In this blog, we compare the best tools for real user monitoring, including their pros, cons, and key features. By the end you will know which one fits your stack.

Data pipeline monitoring 101: Tracking health and performance across the data stack

Data pipelines are systems for moving and processing data. They are made up of concatenated services and data stores that programmatically ingest data from upstream sources; filter, transform, enrich, and route that data; and deliver it to downstream consumers.

Grafana Pyroscope: Call Tree, Heat Map, & Adaptive Profiles (August 2026 Community Call)

We will look at some new features: Call Tree, Heat Map, & Adaptive Profiles Can't comment in the chat? You may need to create a channel. Join us live for an introduction to flame graphs. We’ll cover what they are, how to read them, and how to use them to find performance bottlenecks in your applications. Bring your questions! Grafana Cloud is the easiest way to get started with Grafana dashboards, metrics, logs, traces, and profiles. Our forever-free tier includes access to 10k metrics, 50GB logs, 50GB traces and more.

Top tips: Small digital habits that save you hours every week

Top tips is a weekly column where we highlight what's trending in the tech world and list practical ways to explore these trends. This week, we're looking at something we rarely think about until the end of the day: the tiny digital habits that quietly eat away at our time. Have you finished a workday feeling busy but strangely unaccomplished? You started with the best intentions.

Cavalry or cattle? Let the machine decide

Long before dashboards and decibel-loud alerts, there were watchtowers. Every kingdom worth its salt had them, men perched on hills, lighting fires to signal the moment they spotted something suspicious on the horizon. It was, in its time, a fine system. The trouble was that watchmen, being human, occasionally mistook a herd of cattle for an invading army, or a dust storm for smoke, and lit their fires anyway.

Migrating from Nagios XI to WhatsUp Gold: A Practical Step-by-Step Guide

Monitoring platforms rarely become complex overnight. In many Nagios XI environments, complexity builds gradually through years of useful customizations, custom plugins, one-off fixes, and undocumented operational knowledge. Each addition may have solved a real problem at the time, but over the years the result can become difficult to maintain, explain, and hand over to new administrators.

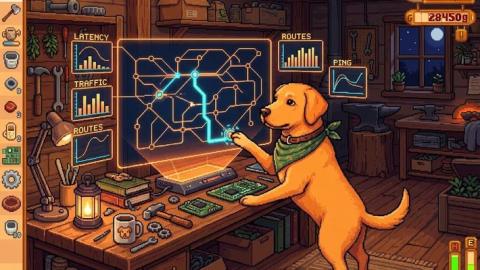
Stop Guessing Where the Network Broke

Modern IT teams invest heavily in monitoring infrastructure, applications, servers, and network devices. Yet when users report that a critical cloud service is slow or a branch office loses connectivity, one question often remains difficult to answer: where is the problem actually occurring? Is the issue inside your network? Is it your ISP? Has a routing change introduced excessive latency? Did an upstream provider experience an outage?

From Log Line to Merged Fix: AI SRE Agent AURA with GitHub MCP

Knowing why it broke is not the same as having it repaired. Point the agent at the repos behind the service and the change comes back as a pull request. A Govee integration crash-loops under Home Assistant because the container cannot write to a directory it does not own. That much was already established: the previous homelab video stopped at the root cause on purpose, so the next pass could improve the agent's configuration first.

Grafana Tempo: Trace diff & span pruning (August 2026 Community Call)

We will look at some new features: trace diff and span pruning Can't comment in the chat? You may need to create a channel. Join us live for an introduction to flame graphs. We’ll cover what they are, how to read them, and how to use them to find performance bottlenecks in your applications. Bring your questions! Grafana Cloud is the easiest way to get started with Grafana dashboards, metrics, logs, traces, and profiles. Our forever-free tier includes access to 10k metrics, 50GB logs, 50GB traces and more.