Operations | Monitoring | ITSM | DevOps | Cloud

The latest News and Information on Monitoring for Websites, Applications, APIs, Infrastructure, and other technologies.

Show off your uptime with SLA badges.

Your uptime is probably better than your customers think. But the proof sits in your UptimeRobot dashboard, where only your team can see it. Starting today, you can put it on your website. SLA badges let you set an uptime target for your monitors, then embed a live badge that shows the uptime you actually delivered, colored against that target. Add it to your site footer, your docs or your GitHub README, and get the result by email at the end of each period.
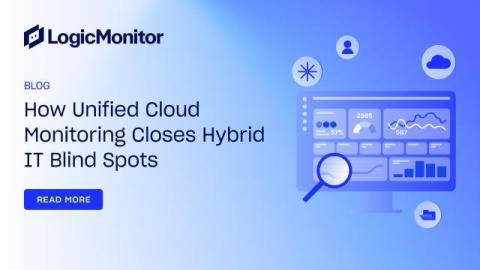
How Unified Cloud Monitoring Closes Hybrid IT Blind Spots

Modern IT runs across public cloud, data centers, containers, SaaS, networks, and AI services. Cloud monitoring delivers more value when those environments share the same observability context, giving teams a clearer way to troubleshoot service issues, manage cloud spend, and support AI-assisted operations.

OpenAI outage on September 14, 2026: "some tools are temporarily unavailable" errors hit ChatGPT worldwide

ChatGPT’s tools and workspace features failed for users around the world on September 14, 2026, with the message “Some tools are temporarily unavailable” blocking spreadsheet and document creation, Codex, Projects, file reading, and dictation while core chat largely kept working. StatusGator sent an Early Warning Signal at 14:41 UTC, 1 hour and 17 minutes before OpenAI publicly acknowledged the incident at 15:58 UTC.

Site24x7 meets HaloITSM: Turn your monitoring alert into a HaloITSM ticket, automatically

Every IT incident response starts the same way. Something breaks, an alert fires, and someone has to act on it. The faster that chain completes, the better your team looks on the SLA reports and the less your users feel it. If you're using HaloITSM, a service desk platform built for enterprise IT operations, that chain now has one fewer link.

VictoriaTraces in VictoriaMetrics Cloud: Complete Observability is Here

Earlier this year, we launched VictoriaLogs in VictoriaMetrics Cloud, bringing fast and cost-effective log management to everyone. Today we launch the final major step toward full observability: VictoriaTraces is now available to all cloud users. With this release, you can now manage all three signals, metrics, logs, and traces, in one place with the predictable pricing, reliability, and the operational simplicity you’ve come to expect from VictoriaMetrics.

The new APM experience: every service monitored from day one, and ready for your AI agent

Coralogix APM has told you which service is behind the latency. From today, the new APM experience tells you what is behind the service: the release, the environment, or the query one layer down. It watches every service you run from the moment it appears, without anyone writing an alert. And everything you see on the screen, your AI agent can use too: in Olly, from the Coralogix CLI, or through MCP in your IDE. A latency chart shows that something got slow.

Path to OTel Code Owner: Lessons from otelhttp (Grafana OpenTelemetry Community Call #10)

In this episode of the Grafana OTel Community Call, we're joined by Sonal Gaud, code owner of otelhttp on opentelemetry-go-contrib. We'll trace her path from writing test-coverage PRs to owning the instrumentation library that most Go services use to get HTTP traces and metrics for free — and go deep on how otelhttp actually works under the hood: context propagation, metrics/attributes via the Labeler, route cardinality, and how the library evolves alongside HTTP semantic conventions.