Operations | Monitoring | ITSM | DevOps | Cloud

The latest News and Information on Monitoring for Websites, Applications, APIs, Infrastructure, and other technologies.

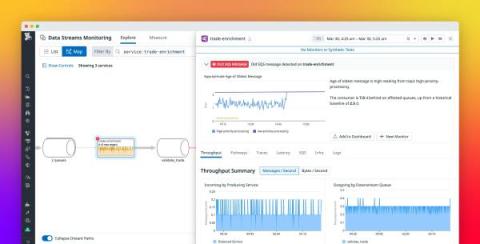
Monitor SQS with Data Streams Monitoring

Datadog Data Streams Monitoring (DSM) provides detailed visibility into your event-driven applications and streaming data pipelines, letting you easily track and improve performance. We’ve covered DSM for Kafka and RabbitMQ users previously on our blog. In this post, we’ll guide you through using DSM to monitor applications built with Amazon Simple Queue Service (SQS).

Getting started with the Elastic AI Assistant for Observability and Microsoft Azure OpenAI

Recently, Elastic announced the AI Assistant for Observability is now generally available for all Elastic users. The AI Assistant enables a new tool for Elastic Observability providing large language model (LLM) connected chat and contextual insights to explain errors and suggest remediation.

Understanding service level agreements (SLAs): The basics

Service Level Agreements, or SLAs, are like business handshakes. They are the promises that companies and service providers make to each other about service quality, like how quickly a website loads or how fast customer service responds. SLAs set clear expectations right from the start, ensuring no surprises along the way and keeping both sides happy.

A Beginner's Guide to Setting Up Status Pages with Uptime.com

Imagine your website or service suddenly goes offline, and, somehow, you’re the last one in the loop. Not the best start to your day, wouldn’t you say? This is where the hero of our narrative steps into the spotlight: status pages. These powerful tools are more than just digital canaries in the coal mine; they are the beacon of transparency and trust for your users, signaling that you’re on top of things—even when things go topsy-turvy.

How to combine POMs (Page Object Models) with Playwright Fixtures for better developer experience

Page object models (POM) are common to encapsulate test automation logic and improve code readability. Learn in this video how to combine POMs and Playwright fixtures for effective end-to-end testing and synthetic monitoring with an excellent developer experience. Got questions? Join the Checkly community Slack. And tune in next week for more on Playwright, Synthetic Monitoring, and API Monitoring. Happy testing!

An SRE's Most Important Skill? Communication

I wish someone had told me that I shouldn’t hop between frameworks. Just like learning four programming languages in your first year, in my experience spending time content switching as a beginner is wasted effort. If I’d spent a solid year learning how to deploy services on AWS, then when it was time to learn Azure, I’d see more similarities than differences and find it a lot easier to pick up a second public cloud.

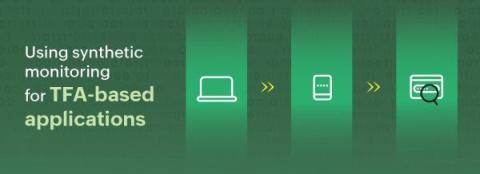
Synthetic monitoring for TFA-backed applications

Two-factor authentication (TFA, sometimes 2FA) is a crucial security measure that adds an extra layer of protection to your online account. It goes beyond the traditional password-based authentication by requiring a second form of verification. In TFA-backed applications, users are supposed to provide two forms of verification before gaining access to their accounts.

Using Telegraf to Feed API JSON Data into Kentik NMS

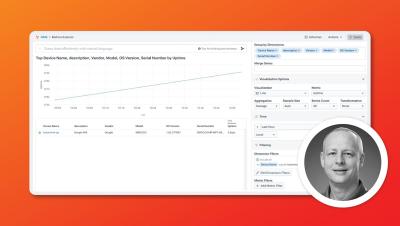
Discover how to harness API JSON data for Kentik NMS using Telegraf in this insightful video by Justin Ryburn. Learn to containerize with Docker Compose, configure Telegraf to collect and transform metrics, and seamlessly integrate them into Kentik's network monitoring system. A step-by-step guide for enhancing your NMS capabilities with API data.

Creating alerts with Grafana | Grafana for Beginners Ep 11

When observing your data with Grafana, you don't need to be glued to your dashboard 24/7. Join Senior Developer Advocate, Lisa Jung to learn how to set up Grafana to keep an eye on your data and alert you if something needs your attention! The following are covered in this episode: ☁️ Grafana Cloud is the easiest way to get started with Grafana dashboards, metrics, logs, and traces. Our forever-free tier includes access to 10k metrics, 50GB logs, 50GB traces and more. We also have plans for every use case.

Datadog on Site Reliability Engineering #shorts #datadog #observability

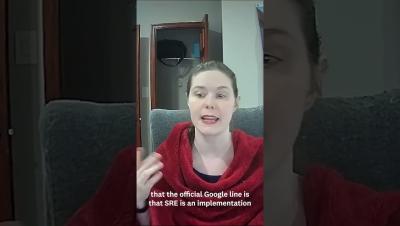
There are many different ways to implement Site Reliability Engineering (SRE). From team structures to roles and responsibilities to planning and prioritization flows, there’s no golden path for how to organize things. As Datadog has shifted from a startup to a quickly-growing public company, we’ve seen our own SRE practice evolve. With over 22,000 customers sending trillions of data points each day, keeping Datadog reliable is critical to our business.