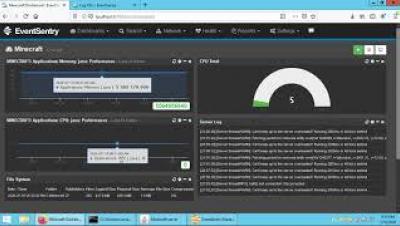
Monitoring a Minecraft server on Windows
How to monitor the logs and performance metrics of a Java-based Minecraft server on Windows with EventSentry.


Talk about performance monitoring to any system admin or IT manager and one of the first questions they will ask is whether the monitoring is agent-based or agentless. The moment you hear that question, you know that they are interested in an agentless monitoring solution. Such is the fear of having agents on critical servers in the infrastructure! In this article, we will discuss.
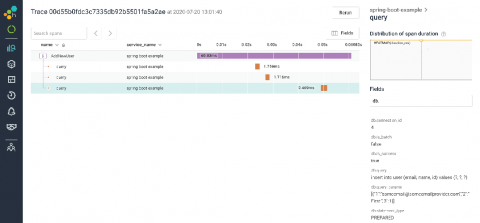
We’ve released some improvements to our Java Beeline library! Allow me to share all the interesting new features.
Client libraries are collections of code that make it easier for developers to write flexible and efficient applications that interface with APIs. Datadog provides client libraries so you can programmatically interact with our API to customize dashboards, search metrics, create alerts, and perform other tasks. We’re pleased to announce that we’ve developed and open-sourced two new client libraries for Java and Go in addition to our existing Ruby and Python libraries.
We’re excited to announce that we’ve strengthened our solution for Java Spring. Spring developers can now integrate Rollbar into their Java Spring Boot and Spring Web MVC applications even more quickly and easily. With our new SDK, instrumentation and getting real-time actionable error alerts takes just a few minutes. Spring has consistently been one of the most popular Java frameworks and we want to make sure we’re consistently offering the best possible solution for it.
One of the hidden gems within eG Enterprise is the ability to perform remote actions and automated tasks using built-in functionality. In conversations with customers and community peers, I often get asked why we at eG Innovations don’t offer functionality in regard to adding custom scripts and a community database of shared scripts.
At LogicMonitor, we are continuously improving our platform with regards to performance and scalability. One of the key features of the LogicMonitor platform is the capability of post-processing the data returned by monitored systems using data not available in the raw output, i.e. complex datapoints. As complex datapoints are computed by LogicMonitor itself after raw data collection, it is one of the most computationally intensive parts of LogicMonitor’s metrics processing pipeline.
If you are anything like us here at Sematext, you are likely always trying to automate any tedious, repetitive tasks. Repetitio est mater… boringdorum. Setting up monitoring falls in that category. You either do it manually every time you provision a new piece of infrastructure or service, or you automate it. Note that by “service” I mean either an instance of your own application or something like Nginx or Elasticsearch or MySQL or …
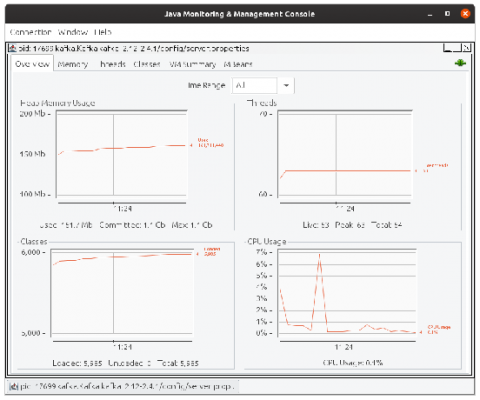
We all know that Prometheus is a popular system for collecting and querying metrics, especially in the cloud native world of Kubernetes and ephemeral instances. But people forget that Java has been running enterprise software since 1995, while Prometheus is a relative newcomer to the scene. It was only created in 2012! Even though Java has had its own metric collectors since before Prometheus was born, none of our new environments speak its (metric) language. How can you bridge that gap?