One of the most commonly used functionalities for String objects in Java is String replace. With replace(), you can replace an occurrence of a Character or String literal with another Character or String literal. You might use the String.replace() method in situations like: In Java, keep in mind that String objects are immutable, which means the object cannot be changed once it’s created.
It’s easy to get started with Java and Honeycomb using OpenTelemetry. With Honeycomb being a big supporter of the OpenTelemetry initiative, all it takes is a few parameters to get your data in. In this post, I will walk through setting up a demo app with the OpenTelemetry Java agent and show how I was able to get rich details with little work by combining automatic instrumentation from the agent with custom instrumentation in the code.
At LogicMonitor, we deal primarily with large quantities of time series data. Our backend infrastructure processes billions of metrics, events, and configurations daily. In previous blogs, we discussed our transition from monolith to microservice. We also explained why we chose Quarkus as our microservices framework for our Java-based microservices. In this blog we will cover.
Every Java developer should follow coding standards and best practices to develop secure Java code. It is critical your code is not vulnerable to exploits or malicious attacks. In recent times, even big organizations like eBay, the CIA, and the IRS have fallen victim to vulnerabilities in their applications that have been discovered and exploited by attackers. The following guidelines provide a solid foundation for writing secure Java code and applications.
Getting visibility into your application is crucial when running your code in production. What do we mean by visibility? Primarily things like application performance via metrics, application health, and availability, its logs should you need to troubleshoot it, or its traces if you need to figure out what makes it slow and how to make it faster. Metrics give you information about the performance of each of the elements of your infrastructure.
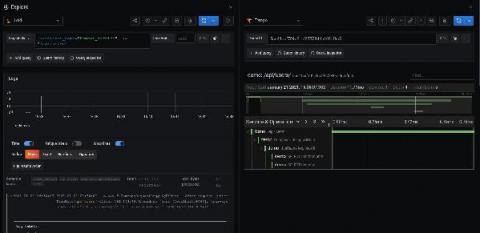
Auto-instrumentation is a subject I have not had much experience with. Here at Grafana Labs, we primarily develop in Go, which doesn’t afford such luxuries. However, there is an enormous amount of interest from the community in Java auto-instrumentation, so I set out to determine what was possible using the shiny new OpenTelemetry auto-instrumentation libraries.
Software developers are often only concerned about the functionality of their applications. When these applications are deployed in production, scalability and performance issues surface and application developers then have to worry about performance. Many a times, such situations warrant a complete restructuring of the application code, causing significant impact to new rollouts and current users.
While tuning the performance of your application at the code level or sizing the JVM appropriately are important for enhancing performance, it is equally important to look at how to tune accesses to the backend database. After all, response time for a web request is dependent on the processing time in the Java application tier as well as the query processing time in the database tier.
In this two-part blog post, we’ll use Elastic Observability to monitor a sample Java application. In the first blog post, we started by looking at how Elastic Observability monitors Java applications. We built and instrumented a sample Java Spring application composed of a data-access microservice supported by a MySQL backend. In this part, we’ll use Java ECS logging and APM log correlation to link transactions with their logs.