Operations | Monitoring | ITSM | DevOps | Cloud

11 Simple Java Performance Tuning Tips

It’s one thing to write code that works. But what about clean, readable, concise code? That’s another thing entirely. To create an app that solves one problem? Not that hard. What about one that not only solves the problem, but it’s also easy and pleasurable to use? Now we’re talking. You could apply the same reasoning for many software properties, which would make for a long article. Instead, let’s focus on only one of those properties: performance.

How to Troubleshoot Java CPU Usage Issues

If you have deployed a Java application in production, you’ve probably encountered a situation where the application suddenly starts to take up a large amount of CPU. When this happens, application response becomes sluggish and users begin to complain about slow response. Often the solution to this problem is to restart the application and, lo and behold, the problem goes away – only to reappear a few days later.

Java runtime monitoring with JVM metrics in Datadog APM

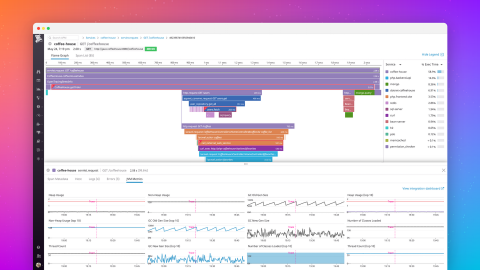
Whether you’re investigating memory leaks or debugging errors, Java Virtual Machine (JVM) runtime metrics provide detailed context for troubleshooting application performance issues. For example, if you see a spike in application latency, correlating request traces with Java runtime metrics can help you determine if the bottleneck is the JVM (e.g., inefficient garbage collection) or a code-level issue.

Monitoring and Troubleshooting Synchronization Issues in Java Applications

Java applications deployed in production must be multi-threaded for scalability. Threads can be used for performing different tasks or they could be executing the same task to service different user requests. Often, it is necessary to synchronize between different threads.

JMX monitoring + Java custom metrics.

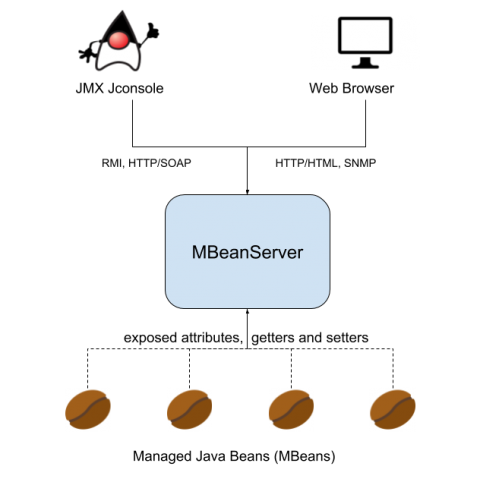
In this tutorial we are going to learn how to instrument Java code to expose application metrics using JMX monitoring. Following the code examples, you can monitor the availability, health and performance of your Java application. Java 1.5 introduced JMX – Java Management eXtensions – which is a standard way to instrument code in the JRE world.

JBoss Performance Monitoring: The Complete Guide

Ensuring your apps work as designed and deliver a productive user experience starts with monitoring applications metrics. This helps you understand whether your software is performing at optimal levels. Many developers use JBoss (now called WildFly and maintained by Red Hat) to build, deploy, and host transactional applications written in Java.

How to Troubleshoot Java Application Slowness Using Java Transaction Tracing

The performance of any application is measured by its availability and responsiveness. When an application is slow, IT operations staff must troubleshoot the cause of slowness, identify it and resolve it. While application performance problems may be caused by issues in the supporting infrastructure, often the issues are related to the application components themselves.

Java Garbage Collection Logging with the ELK Stack and Logz.io

Java programs running on JVM create objects on the heap. At some stage, these objects are no longer used and can pile up as “garbage” needlessly taking up memory. Replacing the manual process of explicitly allocating and freeing memory, the Java Garbage Collection process was designed to take care of this problem automatically.

Java 12: New Features and Enhancements Developers Should Know

Oracle will soon roll out Java 12 in March 2019 and new releases will drop once every six months thereafter. The goal is to make new releases more frequent for the Java ecosystem, with certain releases earmarked as long-term support (LTS). And by support, we mean the allocation of update releases for bug fixes and critical security patches. This latest version offers a list of new features such as Switch Expressions, Default CDS Archives, Shenandoah, Microbenchmark Suite, among others.