Why Manual Control of Your Network Leaves Your Business Vulnerable
Top reasons why you should accelerate automation of network management.


The latest News and Information on Monitoring for Websites, Applications, APIs, Infrastructure, and other technologies.
Top reasons why you should accelerate automation of network management.
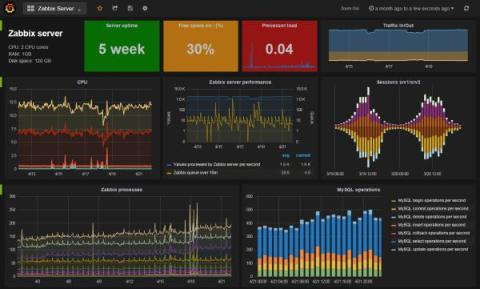
I’m happy to share some exciting news! Grafana Labs is taking ownership of the Zabbix plugin, one of the most popular third-party data sources for Grafana over the years. The Zabbix plugin for Grafana allows you to visualize data from the Zabbix monitoring system, offering a quick and powerful way to create dashboards. I personally started the project in 2015, with the goal of bringing a better dashboarding experience to Zabbix users.
MSPs using CloudHealth are in for an abrupt start to 2024. VMware, which acquired CloudHealth, is ending its partner programs. Instead, they’re rolling out the exclusive Partner Program, starting from February 5, 2024. The switch will impact solution providers, resellers, and cloud services partners. With this new selective partner program, MSPs face fresh challenges in meeting the latest standards.
The digital landscape has dramatically transformed since the world’s first website went live at CERN on August 6, 1991. What began as a single webpage has exploded into a sprawling, intricate web of interconnected services and systems. The modern web is mind-bogglingly vast, complex, and, when it works, beautiful in its precision and technological harmony.
In this realm of cloud and SaaS service uptime, StatusGator offers unparalleled monitoring of nearly 3,000 services. This article delves into the alternatives to StatusGator in 2024, but first, let’s understand what sets StatusGator apart. Unlike typical status page aggregators, StatusGator offers advanced status aggregation with unique capabilities. StatusGator collects the status of almost 3,000 services from official, published, status pages to gain as much information as possible.