Dashboards

Visualize your DevOps data for free

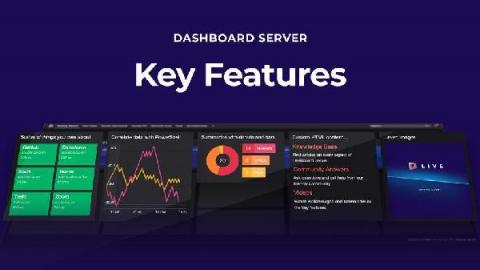
We recently launched the public preview of a new tool that lets anyone dashboard anything – for free. Meet Dashboard Server! You can download it free because we wanted to get our incredible dashboards in the hands of more people. The SCOM community know us well but our dashboards are perfect for so many use cases beyond System Center monitoring. And if you love them as much as we think you will, all we ask in return is that you share that love by spreading the word.

Logz.io Infrastructure Monitoring: Building Visualizations in Dashboards

In a previous post I explained how to send metrics to Logz.io Infrastructure monitoring with Prometheus—now let’s analyze them by building Prometheus dashboards and visualizations in our metrics UI! Once you’ve started to send metric data to Logz.io, how do you visualize and interpret that data so that it’s useful for you? Logz.io Infrastructure Monitoring provides powerful querying and visualization of your data.

Why implementing Grafana Enterprise was a bright idea for U.K. energy supplier Utilita

Energy efficiency is a term often used to describe appliances or light bulbs. But when it comes to business, making sure your sales team — and customers — are being efficient with their personal energy is a big key to success. That was a major lesson learned by Utilita, the U.K.’s first and only specialist Smart Pay As You Go Energy supplier.

Working with the WebAPI tile - tips & tricks

Regardless of the SquaredUp product you use, the WebAPI tile is very useful when it comes to connecting to external data sources and showing them in your dashboards. It brings you closer to that single pane of glass dashboarding dream that we all have, which is why it is also one of our most used tiles!

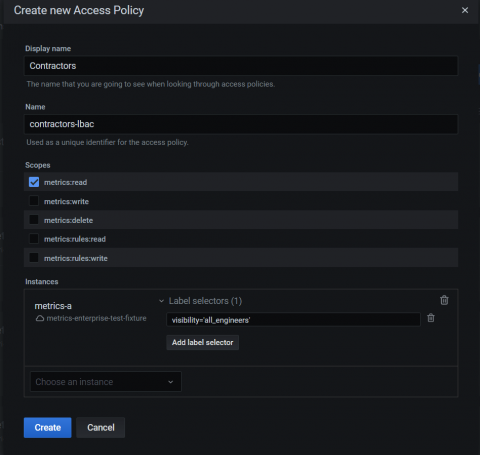
What's new in Grafana Enterprise Metrics for scaling Prometheus: enhanced access control and a compactor that supports 650 million active series and beyond

I’m a fresh starter here at Grafana Labs, leading one of our teams working on the Grafana Enterprise Stack. As a longtime user of Grafana, I couldn’t wait to see what’s new in versions 1.1 and 1.2 of Grafana Enterprise Metrics (GEM), our scalable, self-hosted Prometheus service. I tried out the shiny features and wanted to share some of the cool things I found.

Grafana Loki 2.2 released: Multi-line logs, crash resiliency, and performance improvements

I imagine everyone is long since tired and bored with their Loki 2.1 end of year/holiday gift, so I’m here today to bring some really exciting news. Loki 2.2 is released!!! New to Loki? Want a refresher? Owen Diehl and I did a webinar not long ago. Check out the on-demand video for a good overview of what Loki is capable of in 2021! Lots of new features are in this release, but worth celebrating in particular is that the single most requested feature for Loki has been added!

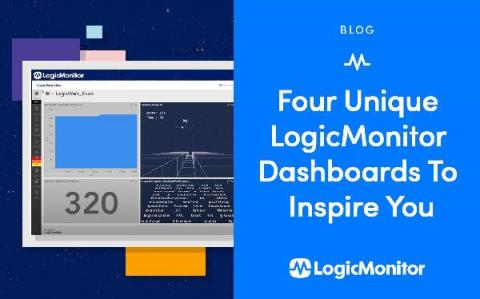
Four Unique LogicMonitor Dashboards To Inspire You

LogicMonitor dashboards are truly customizable — customizable enough to allow users to visualize virtually anything. Dashboards provide our users with a wide array of capabilities, from capacity planning and service availability notifications to root cause analysis and IT spend forecasting capabilities. We’ve seen LogicMonitor users get radically innovative when it comes to creating unique dashboards that add value to their lives both in and outside of work.

What is Grafana?

Today, almost every application stack would usually consist of a number of different applications, each performing a specific role and working together towards a common goal. This is the case whether it be that of a fortune 500 company or a computer science student trying to complete a tech project. As such, the stability and reliability of your infrastructure would greatly depend on the performance of each application within that infrastructure.