Dashboards

How to embed Grafana visualization in SquaredUp

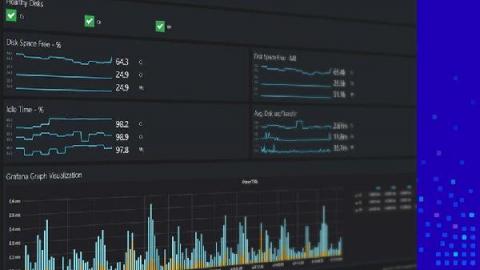
In our previous post on Grafana and SquaredUp, we compared the two tools across various benchmarks like ease of deployment, time to value, dashboard creation, dashboard sharing, and more. Both tools have their specific advantages over the other, but since the ultimate goal is to give you a single place to look – why not leverage Grafana for the visualizations and data sources it offers, but give them meaning by embedding them in SquaredUp?

You should know about... transformations in Grafana

Transformations were introduced in Grafana v7.0, and I’d like to remind you that you can use them to do some really nifty things with your data. All performed right in the browser! Transformations process the result set of a query before it’s passed on for visualization. They allow you to join separate time series together, do maths across queries, and more. My number one use case is usually doing maths across multiple data sources.

Windows network monitoring made easy with OpManager

Network administrators are responsible for the day-to-day operation of computer networks at organizations of any size and scale. Their primary duty is to manage, monitor, and keep a close watch on the network infrastructure to prevent and minimize downtime. Managing a network includes monitoring all the network components, including Windows devices. In any Windows network, the desktops, servers, virtual servers, and virtual machines (VMs), like Hyper-V, run on the Windows operating system.

The new Splunk Infrastructure Monitoring plugin brings the SaaS formerly known as SignalFx to your Grafana dashboards

Greetings! This is Mike reporting from the Solutions Engineering team at Grafana Labs. In previous posts, you might have read our beginner’s guide to distributed tracing and how it can help to increase your application’s performance. In this post, we are back to talk about metrics and showcase another one of our newest favorite Enterprise plugins: Splunk Infrastructure Monitoring (formerly known as SignalFx)!

Layering customer, infrastructure and business perspectives into your monitoring (Part 4)

In my prior three blog posts, we set some ground rules, looked at some out-of-box dashboards, overloaded an in-box property, and finally created an innovative structure to communicate status using SquaredUp's EAM feature. Looking back, when I started this blog, I explicitly stated that traditional monitoring wasn't our goal. It's essential, but the industry (in broad terms) hasn't been successful with monitoring when the only focus is on the infrastructure perspective.

The 3 major benefits that Grafana Cloud customers get from our hosted Prometheus service

Grafana Cloud is the easiest way to get what you need for observability: Prometheus and Graphite for metrics, Loki for logs, and Tempo for tracing, all integrated within Grafana and managed by the Grafana Labs team. You can go from zero to beautiful graphs, insightful logs, and preconfigured alerts in minutes. Built with modern distributed systems techniques, Grafana Cloud allows you to grow with your applications and infrastructure and easily scale past 100M+ metrics.

Use associated template variables to refine your dashboards

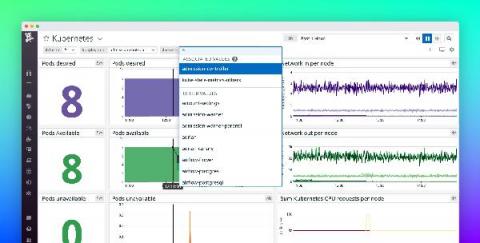
Datadog dashboards provide a foundation for monitoring and troubleshooting your infrastructure and applications, and template variables allow you to focus your dashboards on a particular subset of hosts, containers, or services based on tags or facets. We’re pleased to announce template variable associated values, which can help you speed up your troubleshooting by dynamically presenting the most relevant values for your template variables.

Introducing SquaredUp dashboards for SCOM

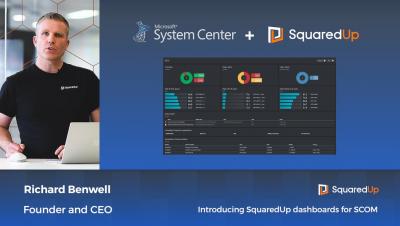
Despite its wealth of monitoring data, SCOM is often seen as a source of noisy alerting and can lack visibility of problems before they impact the business. SquaredUp transforms SCOM into one of the most visible and highly valued tools in your IT organisation. Founder and CEO, Richard Benwell, gives a quick taste of what SquaredUp for SCOM can do in your SCOM environment.