Dashboards

Discover in Kibana uses the fields API in 7.12

With Elastic 7.12, Discover now uses the fields API by default. Reading from _source is still supported through a switch in the Advanced Settings. This change stems from updates made to Elasticsearch in 7.11 with the extension of the Search API to include the new fields parameter. When using the new search parameter, both a document’s raw source and the index mappings to load and return values are used.

Intro to exemplars, which enable Grafana Tempo's distributed tracing at massive scale

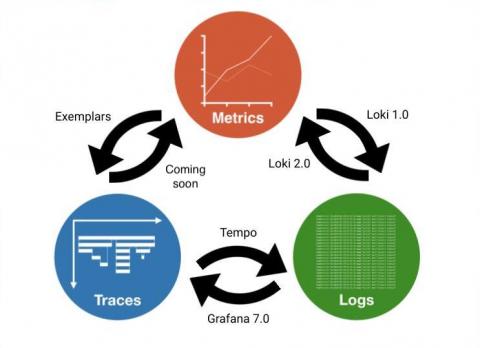
Exemplars are a hot topic in observability recently, and for good reason. Similarly to how Prometheus disrupted the cost structure of storing metrics at scale beginning in 2012 and for real in 2015, and how Grafana Loki disrupted the cost structure of storing logs at scale in 2018, exemplars are doing the same to traces. To understand why, let’s look at both the history of observability in the cloud native ecosystem, and what optimizations exemplars enable.

Getting started with Dashboard Server

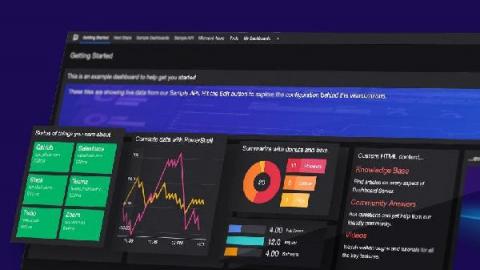
SquaredUp Dashboard Server lets you and your team create beautiful dashboards, for any tool or data, that you can share with everyone in your organization. Here’s a quick introduction to the product where we show you exactly what you can achieve, in no time at all. Let’s start with the three tabs on the top left of the screen: Getting Started, Next Steps, and Sample Dashboards. We’ll run through them one by one.

Want to visualize software development insights with Grafana? With our new Jira Enterprise plugin, you can!

A very fun part of my job as a Solutions Engineer at Grafana Labs is getting to learn the ins and outs of a new feature or play with a plugin while it is still in development. So, when I heard murmurs that our latest Enterprise plugin would be an integration with Jira, I felt the forsaken call of the agile sirens luring me back to my days when I worked as a technical writer on a product team.

How we're graduating Grafana Agent experiments into the official Prometheus project

We’ve been experimenting with new ways to use and operate Prometheus over the past year. Every successful Grafana Agent experiment turns into an upstream contribution for the whole Prometheus community to benefit from. In this blog post, I go over the history of the Agent’s successful — and not so successful — experiments.

Dashboard Server Learning Path

Hey everyone! It’s been a while since we've gone on a learning journey together, after the Azure Monitor Learning Path. I’m thankful for the love that series received, and since then, I've been looking for another opportunity to take on something new and share my learning experience with you all. Finally, the time has come!

Grafana 7.5 released: Loki alerting and label browser for logs, next-generation pie chart, and more!

Grafana v7.5 has been released! This is the last stable release before we launch Grafana 8.0 at GrafanaCONline in June. Register for free now, so you won’t miss the great sessions we’re planning around all things Grafana. And if you’re doing something special with Grafana that you’d like to share with the community, the CFP for GrafanaCONline is open until 06:59 UTC on April 10! Now, back to 7.5.

Circonus Welcomes New Dashboard Builder and Service Dashboards

Over the past few months, we’ve been working on some major updates to Circonus — a new dashboard builder and interface along with several turnkey service dashboards. In the following post, we’ll share the motivation and process behind this project, then walk you through what you can expect. Circonus has provided the ability to create custom drag and drop dashboards for some time. However, this feature was added several years ago.