Operations | Monitoring | ITSM | DevOps | Cloud

APM

The latest News and Information on Application Performance Monitoring and related technologies.

New APM Capabilities Help Optimize Application Performance Across Monoliths or Microservices

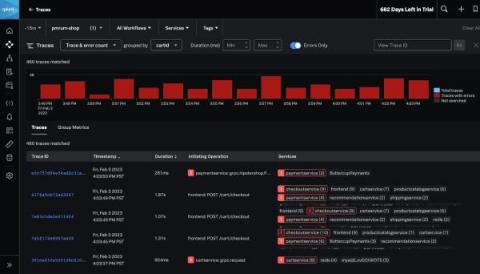
With the goal of helping you get to the “why” faster, Splunk Observability recently announced several new enhancements to reduce noise and provide more visibility when isolating problems in your environments. Specific to applications and services, whether you operate monolithic or microservices architectures our releases help you easily investigate problems in complex environments. Here’s a roundup of the recent Splunk APM capability releases, and helpful links to help get started now.

Implementing OpenTelemetry in React applications

OpenTelemetry can be used to trace React applications for performance issues and bugs. You can trace user requests from your frontend web application to your downstream services. OpenTelemetry is an open-source project under the Cloud Native Computing Foundation (CNCF) that aims to standardize the generation and collection of telemetry data. React (also known as React.js or ReactJS) is a free and open-source frontend JavaScript library for building user interfaces based on UI components.

IGEL Disrupt 2023 - Monitoring IGEL EUC Deployments End-to-End

eG Innovations is an IGEL Ready partner, and I’m delighted to let you all know that we are sponsoring the IGEL DISRUPT End User Computing (EUC) Forum taking place in Nashville, April 3-5, 2023. DISRUPT is a major global event focused on end user computing and the delivery of secure, high-performance digital workspaces to increasingly distributed hybrid workforces, from the cloud. To explore the agenda for the DISRUPT23 Nashville, click here.

Datadog on Data Engineering Pipelines: Apache Spark at Scale

Datadog is an observability and security platform that ingests and processes tens of trillions of data points per day, coming from more than 22,000 customers. Processing that amount of data in a reasonable time stretches the limits of well known data engines like Apache Spark. In addition to scale, Datadog infrastructure is multi-cloud on Kubernetes and the data engineering platform is used by different engineering teams, so having a good set of abstractions to make running Spark jobs easier is critical.

Essential digital experience metrics for development teams

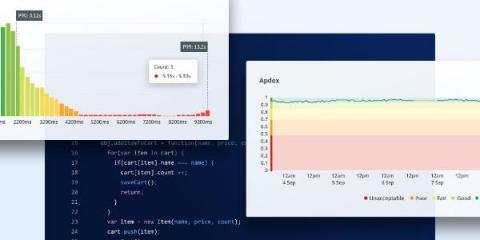
For the team that’s down in the trenches untangling legacy code, writing unit tests, and just trying to come up with sensible variable names, it’s easy to lose sight of the other end of the process, where code meets customer. You test, you deploy, nothing breaks, and you move on. However, it’s just as important to keep an eye on code quality in production, and how it’s experienced. Experience, though, is hard to quantify. What do you measure? How do you measure it?

Redis Monitoring with OpenTelemetry and SigNoz

In this post, we will show you how to set up Redis monitoring with SigNoz - an open-source full-stack APM. SigNoz captures data using OpenTelemetry, which is becoming the world standard for instrumenting cloud-native applications. Apart from capturing metrics from your Redis server, you can also capture logs and traces with OpenTelemetry.