Operations | Monitoring | ITSM | DevOps | Cloud
APM
The latest News and Information on Application Performance Monitoring and related technologies.
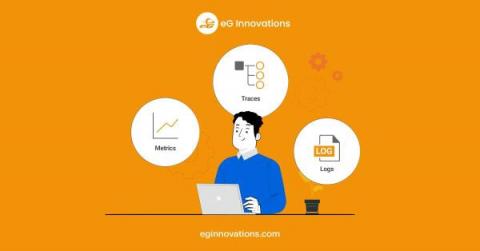
The Three Pillars of Observability: Metrics, Logs and Traces
Metrics, Logs and Traces are often referred to as The Three Pillars of “Observability“. The term observability has been used in control theory to refer to how the state of a system can be inferred from the system’s external outputs. Applied to IT, observability is how the current state of an application can be assessed based on the data it generates. Applications and the IT components they use provide outputs in the form of metrics, events, logs and traces (MELT).
Monitoring your Express application using OpenTelemetry
Monitor your Nodejs application with OpenTelemetry and SigNoz
Java performance optimization tips: How to avoid common pitfalls
Managing Monitoring and Alerting during IT Maintenance
Alerting is a critical feature in monitoring and observability products. The monitoring platform continually tests systems and applications for metrics crossing thresholds, key events in logs and the other warning signs of issues. Alerting ensures that help desks, administrators and IT Ops teams know about issues, or impeding issues and handle communications and remediation rapidly.
Set up application monitoring for your Node JS app in 20 mins with open source - SigNoz
In this article, learn how to setup application monitoring for Node.js apps with our open-source solution, SigNoz. Node.js tops the list of most widely used frameworks by developers. Powered by Google's V8 javascript engine, its performance is incredible. Ryan Dahl, the creator of Node.js, wanted to create real-time websites with push capability. On Nov 8, 2009, Node.js was first demonstrated by Dahl at the inaugural European JSconf.
A Comprehensive Comparison of New Relic and Scout APM
When it comes to getting to the root of a performance problem, nothing beats the lightning-fast speed and precision of Application Performance Management (APM). But choosing between New Relic and Scout can be like navigating a labyrinth of options and considerations. With New Relic, you'll get a top-of-the-line tool that's perfect for some situations, while Scout's streamlined approach fits like a glove in others.


