Operations | Monitoring | ITSM | DevOps | Cloud

APM

The latest News and Information on Application Performance Monitoring and related technologies.

Python Elasticsearch Tutorial - How to use Python Elasticsearch client

Elasticsearch is a popular search engine that can be used to swiftly and almost instantly store, explore, and analyze huge volumes of data. It offers a distributed, multitenant full-text search engine with an HTTP web interface and schema-free JSON documents on top of Apache Lucene. In this tutorial, we will demonstrate how to communicate with an Elasticsearch cluster using a Python Elasticsearch client.

How to Protect your IT Ops from Cloud Outages

Over the past few months, I’ve written a couple of blogs analyzing significant Azure outages that affected multiple services. These articles covered detecting cloud outages long before Microsoft confirmed them and provided details of symptoms we saw. You can read these articles about a September 2022 outage and another in January 2023.

Why Seven.One Entertainment Group Chose Datadog RUM for Client-side Observability

Hear why Seven.One Entertainment Group, a subsidiary of ProSiebenSat.1 Media SE , which is Germany’s top commercial broadcaster, chose Datadog Real User Monitoring and how the solution enabled them to better understand client-side issues.

Performance and User Experience Monitoring for Citrix Linux Workspaces

Citrix for Linux VDI and DaaS options allow organizations to deploy Linux digital workspaces and Linux applications that can then be accessed by end-users from Linux or non-Linux endpoints. This allows organizations to deploy applications optimized for Linux OSs to users using mobile, Mac, Windows, and BYOD (Bring Your Own Device) endpoints as well as those using native Linux.

OpenTelemetry vs Datadog - Choosing between OpenTelemetry and Datadog

OpenTelemetry and DataDog are both used for monitoring applications. While OpenTelemetry is an open source observability framework, DataDog is a cloud-monitoring SaaS service. OpenTelemetry is a collection of tools, APIs, and SDKs that help generate and collect telemetry data (logs, metrics, and traces). OpenTelemetry does not provide a storage and visualization layer, while DataDog does.

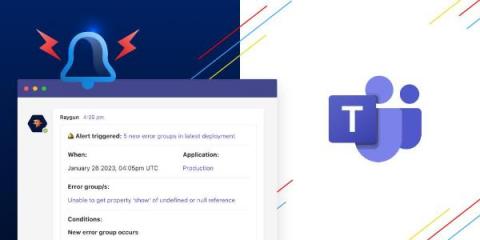
Microsoft Teams for Alerting has landed

Get crucial error and performance diagnostics sent directly to your chosen Microsoft Teams channel with Raygun Alerting. As of 2022, Microsoft Teams has surpassed Slack’s 18 million active users with a user base of over 270 million, solidifying its position as the leading business communication platform. In August 2021, we released our Slack for Alerting integration, and now it’s time to extend that capability to Microsoft Teams.

Datadog On Reliability Engineering

There are many different ways to implement Site Reliability Engineering (SRE). From team structures to roles and responsibilities to planning and prioritization flows, there’s no golden path for how to organize things. As Datadog has shifted from a startup to a quickly-growing public company, we’ve seen our own SRE practice evolve. With over 22,000 customers sending trillions of data points each day, keeping Datadog reliable is critical to our business.

New compact views in Logs tab, improved correlation between signals, and 2000+ community members - SigNal 22

Welcome to our monthly product newsletter - SigNal 22! Last month our team worked on improving the logs tab and improved the correlation between telemetry signals to drive contextual insights faster. We were also trending on GitHub and crossed 2000+ developers in our slack community. Let’s dive in to see what humans at SigNoz were up to in the month of February 2023.