Mailchimp
Not subscribed to OpsMatters Newsletter


You’ve created the perfect design for your indices and they are happily churning along. However, in the future, you may need to reconsider your initial design and update the Elasticsearch index settings. This might be to improve performance, change sharding settings, adjust for growth and manage ELK costs. Whatever the reason, Elasticsearch is flexible and allows you to change index settings. Let’s learn how to do that!
Businesses around the world have been forced to adopt remote working policies in response to the COVID-19 outbreak. In just two months, a vast number of employees around the world shifted to a work-from-home environment. Although some businesses already had many of their IT operations available on the cloud before the pandemic—with the help of cloud-hosted email and collaboration suites such as Office 365—no one expected such a sudden and widespread transition into teleworking.
If you’re using Linux, I’m sure you bumped into journald: it’s what most distros use by default for system logging. Most applications running as a service will also log to the journal. So how do you make use of these logs to: In this post, we’ll answer all the above and more. We will dive into the following topics: There are lots of other options to centralize journal entries, and lots of tools to help.
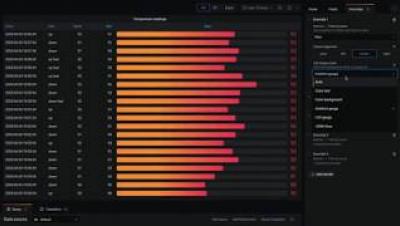
Grafana v7.0 is coming next month! Here’s a sneak peek of one of its features: a brand-new table panel. The current (old) table panel has accumulated a ton of feature requests over the years, and we are excited to finally close many of them in 7.0 with this new table panel. Among the many new things this panel can do is to include other visualizations inside cells. For example, you can configure a cell style (per column) to render the value as a bar gauge.