Operations | Monitoring | ITSM | DevOps | Cloud

Blog

How to Monitor AWS Elastic Beanstalk with CloudWatch

AWS Beanstalk allows you to spin up entire environments (EC2 instances, ELBs, etc.) to support an application without you having to configure the resources manually. However, since it’s a managed service, you have less visibility with traditional monitoring tools. As such, it becomes even more important to take advantage of the available monitoring tools in AWS. In this post, we’ll explain how to use CloudWatch to monitor Beanstalk and what is important to watch.

Synthetic Monitoring

Synthetic Monitoring is referred to as an approach of testing a web service or a website by simulating the website visitors’ requests across various geographies in order to test its availability and performance. One can compare performance stats of different geographies and formulate performance improvement plans. Synthetic monitoring lets you find problems before your customers do leading to shorter MTTR.

Deploy Kubernetes on Raspberry Pi cluster with k3s

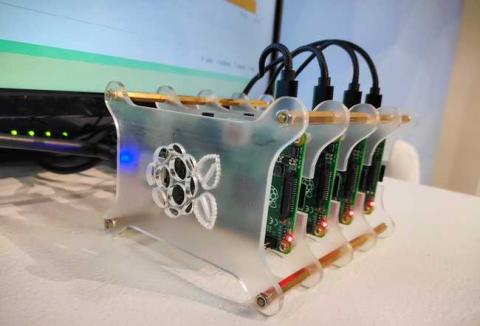
In order to carry out a demonstration of our smart tool: the Bleemeo agent at the 8th Devoxx France conference planned for the 17th of April, Bleemeo team decided to use the Kubernetes infrastructure and specially the lightweight version of Kubernetes: k3s. We choose to run k3s on a cluster of 3 Raspberry Pi nodes composed of 1 master node and 2 slaves nodes.

Introducing Mattermost Academy: Our Free Online Training Program

At Mattermost, we built an intuitive workplace messaging platform that all kinds of teams can use productively right away, regardless of technical prowess. That said, we understand that learning new platforms isn’t always the easiest thing in the world. Some Mattermost users will have longer learning curves than others, and that’s perfectly okay. We all march at different speeds.

How to collect, customize, and analyze PHP logs

PHP logs are not just about errors. You can use logs to track the performance of API calls and function calls, or to count the occurrence of significant events in your applications (e.g., logins, signups, and downloads). Whether you’re operating a microservices architecture or a monolith, implementing a comprehensive PHP logging strategy will allow you to track critical changes in your applications and optimize their performance.

We're an April 2019 Gartner Peer Insights Customers' Choice for SIEM-thanks to you!

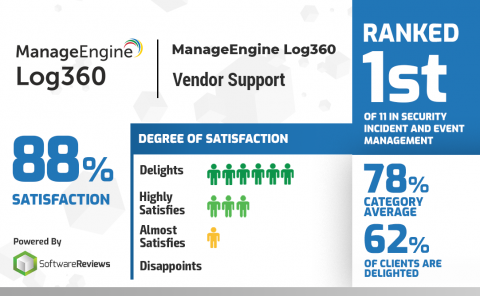
We’re happy to announce that ManageEngine is an April 2019 Gartner Peer Insights Customers’ Choice for Security Information and Event Management (SIEM). While Gartner analysts recognized ManageEngine in its Magic Quadrant for Security Information and Event Management * for three consecutive years, this Customers’ Choice distinction makes us even more proud because we see it as proof that our customers are happy with the technology we provide.

Grafana 5.4.4 and 6.1.6 released with important security fix

Today we are releasing Grafana 5.4.4 and 6.1.5. These patch releases include an important security fix for all Grafana installations between 5.4.0 and 6.1.6. Grafana installs between 6.0.0 and 6.1.4 are less vulnerable due to other security improvements. These versions are only vulnerable if the administrator has disabled default security settings.