Operations | Monitoring | ITSM | DevOps | Cloud
Blog
PagerDuty's Slack Integration Makes Real-Time Ops Even Easier
This week, Slack users from around the world will converge along the San Francisco waterfront for the 2019 Slack Frontiers event. Teams of all types and sizes will attend customer and product sessions geared toward helping teams improve and take their ChatOps to the next level. Are you attending Slack Frontiers this week? If yes, swing by the PagerDuty booth to say hello and see our Slack app in action!
Impact Alert: Why Was a Spike in Hotel Bookings No Cause for Celebration?
One of the world’s leading bed banks – a wholesaler of hotel allocations to B2B and B2C clients – recently experienced a surge in bookings. Great news, right? Not really. A glitch caused room prices from one of their hotel suppliers to drop from $100+ per night to JUST $8. Imagine how much this glitch could have cost them if left unchecked.
Glitch List: April 2019
Glitches happen. Even to the best of us. And rather than promote others’ misfortune, we created this list to highlight the importance of anomaly detection – and as a warning against denial. Because if it can happen to the world’s most-recognized companies, it can certainly happen to you.
OnPage Publishes 2019 Incident Management Trends Report
The OnPage team is excited to announce the publication of its 2019 Incident Management Trends Report, providing primary analysis and data compiled from IT and MSP survey respondents!
MicroProfile-OpenTracing with Supersonic Subatomic Quarkus
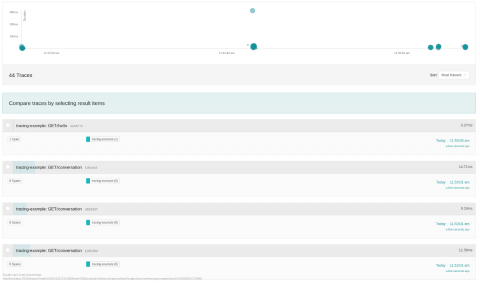
In this article we will demonstrate some of the tracing features of the MicroProfile-OpenTracing project while evaluating performance of new Java runtime Quarkus. You will also learn how a Java application can be compiled to native code for supersonic performance!
451 Research and IDC Call Out OpsRamp's Innovations for Service-Centric AIOps and Hybrid Cloud Management
The second quarter of 2019 started with a bang for OpsRamp, with recognition from two independent analyst firms, 451 Research and IDC. Three recent analyst reports highlighted OpsRamp’s modern digital and IT operations management platform for dynamic performance insights and maximum visibility.
From SRE to QE - Full Visibility for the Modern Application in both Production and Development
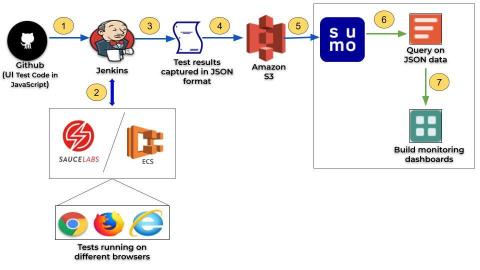
Site reliability engineers (SREs) rely on monitoring and analytics tools like Sumo Logic to guarantee uptime and performance of their applications and various components or services in production. The ability to visually monitor, automatically generate alerts and efficiently troubleshoot an issue in real time has become table stakes for any modern SRE team.
Monitoring Kubernetes + Docker, part 3: Sensu + Prometheus
In part 1 of this series, we discuss the rise of Kubernetes and Docker for containerization and container orchestration. I also shared some of the challenges these new technologies present and what sources of data we use to monitor Kubernetes. Part 2 dives into collecting Kubernetes data with Prometheus, plus the pros and cons of that approach. As promised in the conclusion of that post, I’ll address those cons — showing how Sensu and Prometheus form a complementary solution.
How to Serverless Locally: The Serverless Dev Workflow Challenge
One of the biggest challenges when adopting serverless today is mastering the developer workflow. “How do I develop locally?”, “How should I test?”, “Should I mock AWS services?”. These are common serverless questions, and the answers out there have been unsatisfying. Until now.


