User Experience Monitoring with Elastic Observability Synthetics
Learn how Elastic observability can help you understand the user's journey and experiences on Elastic Observability's Synthetics Monitoring.


In today's remote work environment, virtual desktop infrastructure (VDI) solutions such as Citrix have become essential tools for organisations to enable their employees to work from anywhere. Citrix provides access to virtual desktops, applications, and data, allowing employees to work from any device and location. However, to ensure a seamless user experience, it is essential to have comprehensive monitoring of the Citrix environment. Unfortunately, many IT teams need help identifying and resolving issues that impact the user experience, particularly when the problems are intermittent or challenging to reproduce.
We’ve all been in the situation before: it’s Friday at 5 PM and the only on-call engineer available to handle incidents is about to hit the slopes. Unfortunately, at that very moment, a customer reports to support that they are unable to access the company’s ecommerce website to complete a purchase. Internal monitoring systems seem quiet and services appear available on internal health dashboards.
We’ve all been in the situation before: it’s Friday at 5 PM and the only on-call engineer available to handle incidents is about to hit the slopes. Unfortunately, at that very moment, a customer reports to support that they are unable to access the company’s ecommerce website to complete a purchase. Internal monitoring systems seem quiet and services appear available on internal health dashboards.
Checkly is the synthetic monitoring platform that scales. A core part of the Checkly platform is our monitoring as code workflow, which just got a massive boost with the launch of our TS/JS native Checkly CLI which is now in beta!
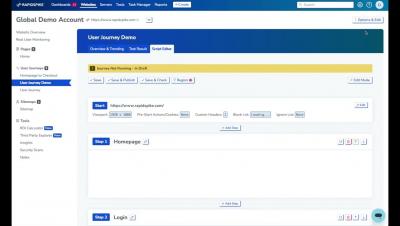
Elastic has an entirely new Heartbeat/Synthetics workflow superior to the current workflow. If you’re a current user of the Elastic Uptime app, read on to learn about the improved workflow you can use today and should eventually migrate toward.
You're probably familiar with Splunk. It's one of the most popular big data solutions organisations worldwide use to monitor their systems in real-time. But you may not know that Splunk also offers synthetic monitoring solutions via 2 Steps. 2 Steps Synthetic Monitoring for Splunk is a powerful tool that can help you speed up your application troubleshooting process. Today we'll take a closer look at what it is and how it can benefit your organisation.