Operations | Monitoring | ITSM | DevOps | Cloud

Observability

The latest News and Information on Observabilty for complex systems and related technologies.

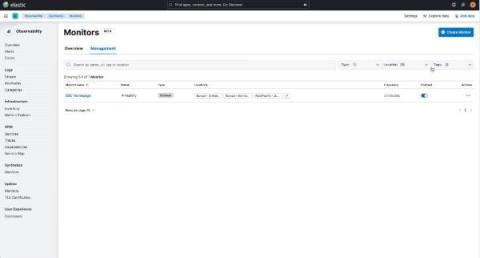
Observing your application through the eyes of a user: A brand new synthetic monitoring experience is coming

Understanding if your applications are not just available but also functioning as expected is critical for any organization. Third-party dependencies and different end-user device types means that infrastructure monitoring and application observability alone are not enough to spot and minimize the impact of application anomalies.

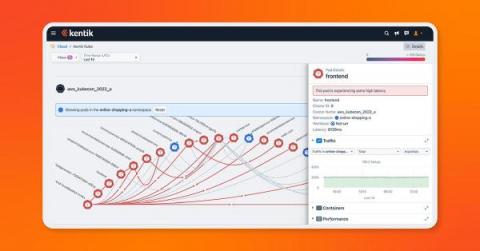
Kentik Kube extends network observability to Kubernetes deployments

We’re excited to announce our beta launch of Kentik Kube, an industry-first solution that reveals how K8s traffic routes through an organization’s data center, cloud, and the internet. With this launch, Kentik can observe the entire network — on prem, in the cloud, on physical hardware or virtual machines, and anywhere in between.

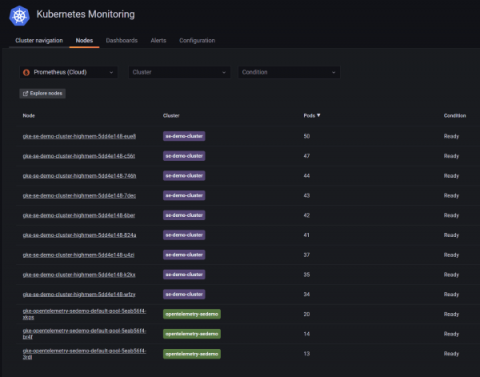
How to monitor the health and resource usage of Kubernetes nodes in Grafana Cloud

The spine is essential to perform every activity, like crawling, walking, or swimming. Just as the spine is necessary to enable these functions, your Kubernetes infrastructure needs a backbone to be efficient and effective. So if Kubernetes clusters act as the spine of your architecture, then Kubernetes nodes are like the vertebrae — they make up a Kubernetes cluster in the same way the vertebrae form the spinal column.

Announcing New GitHub Actions + Honeycomb Integration Guide

If you build or maintain code in GitHub, the Honeycomb Buildevents Action can help you optimize the performance of your build pipelines in GitHub Actions. This blog introduces you to the gha-buildevents Action and a new hands-on quickstart guide that will show you the inner workings of GitHub Actions workflows, the buildevents tool, and the Honeycomb UI.

Unified Observability: Announcing Kubernetes 360

Ask any cloud software team using Kubernetes (and most do); this powerful container orchestration technology is transformative, yet often truly challenging. There’s no question that Kubernetes has become the de-facto infrastructure for nearly any organization these days seeking to achieve business agility, developer autonomy and an internal structure that supports both the scale and simplicity required to maintain a full CI/CD and DevOps approach.

Real-Time Embedded Linux Observability with Pantavisor and InfluxDB

This article was originally published on HackMD and is reposted here with permission. Presently organizations are unable to monitor millions of embedded Linux devices in real-time. With so many different architectures and device types, aggregating telemetry and metrics and viewing that data in a centralized analysis tool is problematic. Onboarding embedded Linux devices into a telemetry service so that metrics can be easily observed is a significant challenge.

Grafana and Cilium: Deep eBPF-powered observability for Kubernetes and cloud native infrastructure

Today, Grafana Labs announced a strategic partnership with Isovalent, the creators of Cilium, to make it easy for platform and application teams to gain deep insights into the connectivity, security, and performance of the applications running on Kubernetes by leveraging the Grafana open source observability stack.

Import Datadog Traces Into Honeycomb

Getting existing telemetry into Honeycomb just got easier! With the release of the Datadog APM Receiver, you can send your Datadog traces to the OpenTelemetry Collector, and from there, to any OpenTelemetry-compatible endpoint. Often, evaluating a new tracing solution requires re-instrumenting your applications from the ground up in a new vendor’s tooling. It’s a pretty high bar to clear just to see if a solution is worth adopting.

Sponsored Post

What Is the Controllability and Observability of Cloud Applications?

There are many computing resources used in different cloud application services to provide online software-as-a-service (SaaS). SaaS differs from traditional applications in that it works from a cloud computing environment. This means that both the application service as well as user data are being hosted by a cloud provider in the cloud. Therefore, the SaaS and data are accessible from anywhere as long as there's online access. This model provides a distinct advantage from a software perspective.

Introducing PrivateLink Support for Enterprise

Network topology can get very complicated in the cloud, especially when you’re sending data to external SaaS providers. You will likely need to configure gateways and firewalls and keep close tabs on those points of egress. However, if your infrastructure exists within AWS, there’s a much simpler way and that’s through an AWS PrivateLink endpoint.