Operations | Monitoring | ITSM | DevOps | Cloud

Observability

The latest News and Information on Observabilty for complex systems and related technologies.

New Honeycomb Integration With ServiceNow

Today, I’d like to tell you about a new community-contributed integration that connects Honeycomb to your ServiceNow workflows. My new integration reimagines what’s possible when connecting observability tools with ITSM systems. This post explains how it works and how to get started with it.

What is Observability: A Beginner's Guide

Observability is a methodology that you incorporate into your enterprise architecture to provide greater visibility into what is happening. It helps us determine the states of the system from their external outputs and allows technicians to identify bottlenecks, predict issues and mitigate them. As the architectures of IT systems are becoming more complex and distributed we use observability to meet the need to measure their internal states.

Observability Is a Data Analytics Problem

Observability is a hot topic in the IT world these days. It is oftentimes discussed through the lens of the “three pillars of observability”: Logs, Metrics and Traces. Indeed these telemetry signal types help us understand what happened, where it happened and why it happened in our system.

The Challenges of Multi-Cloud Management and How Observability Helps Solve Them

When I started my career in information technology, I worked for a large insurance company in Omaha, Nebraska. At the time, they exclusively used Lotus Notes, an IBM product. Even as Microsoft Outlook gained popularity and functionality, the cost of changing email clients was insurmountable, so the company continued using Lotus Notes for many years.

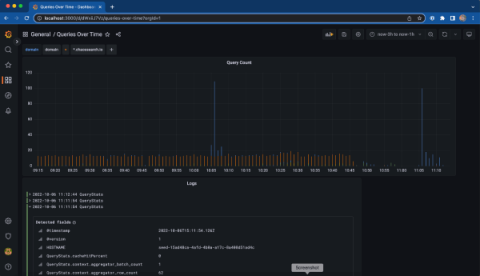
Tutorial: How to Use ChaosSearch with Grafana for Observability

In my last blog post, Building a Cost-Effective Full Observability Solution Around Open APIs and CNCF Projects, we introduced using ChaosSearch in combination with the most popular open source front- and back-ends in the application observability space. In case you missed it, the TL;DR version is that you can use a variety of open source projects and open API-based components to build the best-of-breed observability stack of your choice rather than relying on expensive, all-in-one solutions.

How to Gain Observability into Your CI/CD Pipeline

We all know that observability is a must-have for operating systems in production. But we often neglect our own backyard — our software release process. We noticed we made that mistake here at Logz.io. We were wasting time and energy in handling failures in the CI/CD pipeline, and made our Developer-on-Duty (DoD) shifts tedious. That’s why it’s critical to incorporate your observability practices into your CI/CD pipeline.

The future of observability is cloud-native and unified

Building modern, cloud-native applications introduces new challenges to teams and organizations. As these systems grow and scale, struggles abound: inconsistent performance monitoring experiences across siloed tools, wasteful performance management practices with duplicated efforts, and mounting frustration from colleagues and customers. Surmounting these challenges requires multiple sources of data and truly unified observability.

Elastic Announces Innovations to Transform the Way Organizations Search, Observe and Protect their Data

The new changes to Elastic Search will simplify Elastic Cloud on AWS experience with automatic provisioning of Elastic Agent to easily ingest data from any AWS service and improve search relevance with machine learning-based hybrid scoring.

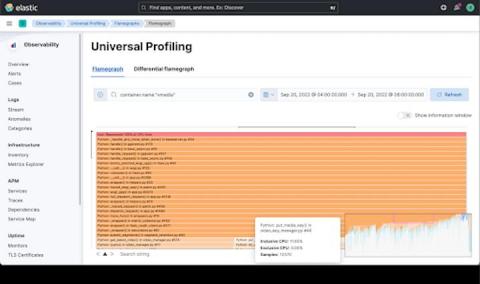
Elastic Universal Profiling helps you deliver fast, affordable, and efficient services

So, what is Universal Profiling™? Universal Profiling™ is fast emerging as an important component of observability. A standard feature inside hyperscalers since approximately 2010, the technology is slowly percolating into the wider industry. Universal Profiling™ allows you to see what your code is doing all the time, in production across a wide range of languages and can profile both user-space and kernel-space code.