Operations | Monitoring | ITSM | DevOps | Cloud

Monitoring

The latest News and Information on Monitoring for Websites, Applications, APIs, Infrastructure, and other technologies.

The Evolution of Sampling in Honeycomb: Introducing Refinery 2.0

Honeycomb's Refinery is a tool that customers can use to help manage the volume of their telemetry. It's rare to have too much telemetry—it's not often that someone says "I wish I didn't have all this information!" However, telemetry is data, and data is not necessarily information—particularly when you’re drowning in it. Honeycomb's query engine is so fast and powerful that many customers can send us all their telemetry.

How to launch games that don't crash (often)

Building and supporting a video game project is challenging. It is a complex and intricate process that balances difficult time constraints and ambitious goals while keeping a highly engaged and demanding user base happy. Game developers need every advantage possible in the development and support process to succeed. One of the best ways to ensure that a game is successful is to make sure that every shipped version of the game project contains as few crash-causing defects as possible.

Why Self-Hosting Monitoring So Complex and How MetricFire Can Help

The rise of self-hosting has revolutionized the way businesses operate online. With organizations increasingly moving away from traditional hosting services to manage their own infrastructure, the need for effective monitoring solutions has become paramount. However, self-hosting monitoring poses numerous challenges that can make it a daunting task for many businesses.

Client Library Deep Dive: Python (Part 1)

Community Client libraries are back with InfluxDB 3.0. If you would like an overview of each client library then I highly recommend checking out Anais’s blog on their status. In this two-part blog series, we do a deep dive into the new Python Client Library and CLI. By the end, you should have a good understanding of the current features, how the internals work, and my future ideas for both projects.

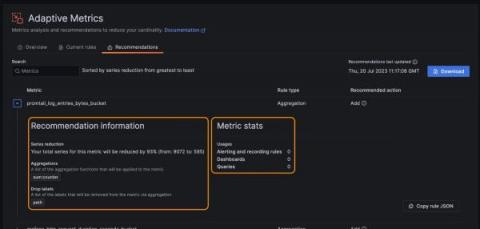
5 steps to start saving on your observability bill with Grafana Cloud Adaptive Metrics

In the observability space, it seems like everyone is talking about how to reduce costs and control the explosion of Prometheus metrics. It’s no wonder — our recent analysis of user environments suggests 20% to 50% of metrics generated are never used, but users are still stuck paying for them.