The latest News and Information on Monitoring for Websites, Applications, APIs, Infrastructure, and other technologies.
SIGNL4’s core job is to reliably alert operational teams. However, we’ve been asked a couple of times if SIGNL4 can also monitor a website’s uptime. Well, we developed an app and it is now available in the SIGNL4 app gallery. You can now monitor the availability of websites AND get instantly alerted if is goes down. This can be set up in minutes. The new SIGNL4 app “Website Monitoring” checks the availability of a website and queries its URL in configurable intervals.
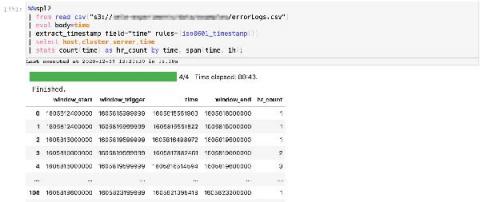
Isn’t all logging pretty much the same? Logs appear by default, like magic, without any further intervention by teams other than simply starting a system… right?
In helping users unify and contextualize all their observability data, Grafana is completely database-agnostic. “We believe that organizations get the best view of what’s going on when they pull in their data from wherever it lives,” said Raj Dutt, CEO of Grafana Labs, the company behind Grafana.
Wait, what? An activity log in SCOM? Did I read that right? You sure did! If you haven’t heard it yet, Microsoft recently published some auditing reports as part of SCOM 2019 UR2 that enable you to track management pack actions, override tracking, management pack objects, etc. The official Microsoft release notes are here.
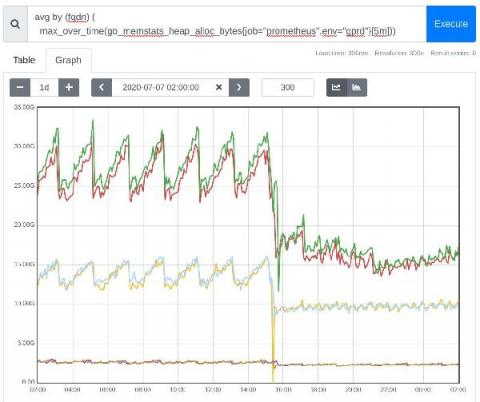
This release broadens our commitment to open standards, interoperability, and extensibility with a new generic Prometheus collector that works seamlessly with any application that makes its metrics available in the Prometheus/OpenMetrics exposition format, including support for Windows 10 via windows_exporter. Netdata will autodetect over 600 Prometheus endpoints and instantly generate charts with all the exposed metrics, meaningfully visualized.