The latest News and Information on Monitoring for Websites, Applications, APIs, Infrastructure, and other technologies.
In early 2020, the Wavefront team was merged into the newly formed “Tanzu” portfolio under VMware’s Modern Applications business unit.
Often there’s a focus on how a service is running from the perspective of the organization. But what does service health monitoring look like from the perspective of a user? Today, understanding your end users’ experience is a key component of ensuring your website or application is functioning correctly. Having a website that is performing well regardless of location, load, or connection type is no longer a nice-to-have, but rather a requirement.
In collaboration with the AWS team, we have just launched another AWS integration, the X-ray data source. Combined with the CloudWatch and Timestream integrations, the AWS X-Ray data source simplifies monitoring and triaging with one Grafana console. The addition of the AWS X-ray data source reflects Grafana’s commitment to becoming a full observability platform that supports distributed tracing as well as metrics and logs.
This latest release of SquaredUp for SCOM and SquaredUp for Azure is focused on addressing the most popular enhancements that our customers have requested.
Content Distribution Networks (CDN) have been around for more than two decades, and as per Intricately 2019 report, there are over a million companies leveraging CDN services from across the world. In the chart below, they have compared four popular CDNs but there are several other major CDN providers such as Verizon Media (Edgecast) and Lumen. Large enterprises such as Linkedin, Ebay, Walmart, and others have already implemented a multi-CDN approach to power all their applications.
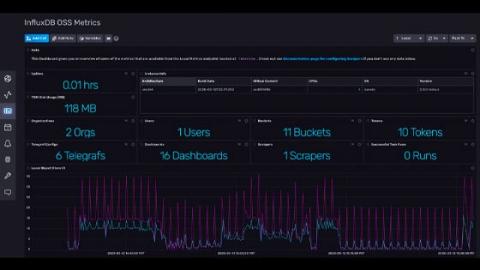
In this post we translate subqueries, using InfluxQL in InfluxDB version 1.x, into Flux, a data scripting and functional query language in InfluxDB version 1.8 and greater in either OSS or Cloud. The subqueries translated here come from this blog. This blog assumes that you have a basic understanding of Flux. If you’re entirely unfamiliar with Flux, I recommend that you check out the following documentation and blogs.
The abundance of programming languages available today gives programmers plenty of tools with which to build applications. Whether long-established giants like Java or newcomers like Go, applications need monitoring after deployment. In this article, you will learn how to ship Golang logs to the ELK Stack and Logz.io. It’s usually possible to get an idea of what an application is doing by looking at its logs. However, log data has a tendency to grow exponentially over time.
Whenever you build a service and expose a set of endpoints to provide API access to that service, you’ll likely need to track their availability and response times, aside from ensuring their functionality. But to actually know that “something is down” or just “not performing” you need to consistently monitor your services day in day out and that’s how Heartbeat from the Elastic Beat family helps you with Uptime Monitoring.