Operations | Monitoring | ITSM | DevOps | Cloud

The latest News and Information on Monitoring for Websites, Applications, APIs, Infrastructure, and other technologies.

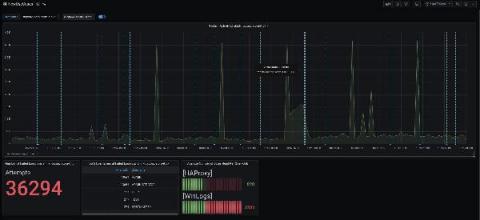
How to get started quickly with the new synthetic monitoring feature in Grafana Cloud

We recently launched synthetic monitoring, which helps you understand your users’ experience and improve website performance by proactively monitoring your services. This feature, which surfaces the powerful capabilities of Prometheus blackbox exporter, is the next iteration of worldPing.

Coralogix - Panel Discussion: Elasticsearch is Not Open Source Anymore

Does SSPL license endanger your intellectual property? As of January 2021, Elasticsearch is no longer open source. From version 7.11 and onwards, all ELK products (Elastic, Logstash, Kibana) will be registered under the new SSPL license created by Mongo and now adopted by Elastic. In this panel, our IP expert lawyer discusses the new license and helps explain whether it impacts your business or puts it at risk.

Open Source in Application Monitoring

Open source projects are a powerful way to accelerate application development. Open source as a support function to monitoring can help support standards and better Observability and Monitoring practices. Learn about the OpenTelemetry project as a tool to improve the quality and flexibility of traces, spans, logs for better monitoring and Observability practices.

observIQ's Stanza Log Agent Now Part Of OpenTelemetry Project

Today I’m happy to announce that observIQ’s Stanza Log Agent will become a key part of the OpenTelemetry project. This has been in the works for many months and the team at observIQ is thrilled to see it becoming a reality. We’re particularly pleased to see it happening just as we launch our log management platform which will be the first platform to take full advantage of the log agent technology now incorporated into OpenTelemetry.

5 Best Network Management Software and Tools

With IT technology continuing to rapidly evolve, networks are becoming increasingly complicated, sophisticated, and sizable. The accelerating growth rate of network technology is caused in part by the increased adoption of IoT, the cloud, and software-defined networking. In this environment, where technology is advancing with overwhelming speed, enterprises must adapt and be agile enough to manage network configurations for all their connected devices.

How-To: Improving SEO with RUM

In this How-To video, we’re going to look at Real User Monitoring in the context of how you can apply it to a specific use case. Real User Monitoring, or RUM, is an event-based solution for monitoring customer experience. In other words, it measures the performance of a webpage from the perspective of the user’s machine. In our previous video on RUM, we looked at how to set up a RUM tag. Today, we’ll specifically examine RUM data in the context of improving SEO scores.

Creating dashboards based on custom filters

In this blogpost, I explain how to create dashlets using custom filters. This way you can create dashlets of your own which you find is necessary. Having dashboards in fact improves monitoring. Dashlets are the different sections under the given dashboard, which are the snapshots of some monitoring views and are defined by a name. Requirements: Icinga 2 and Icinga Web 2 installed.

Cypress vs Selenium vs Playwright vs Puppeteer speed comparison

Our recent speed comparison of major headless browser automation tools, namely Puppeteer, Playwright and WebDriverIO with DevTools and Selenium, received a very positive response. The single most common ask from our readers was that we follow up by including Cypress in our benchmark. In this article, we are doing just that - with some precautions.

Monitoring vs Observability: Can You Tell The Difference?

Monitoring vs observability – is there even a difference and is your monitoring system observable? Observability has gained a lot of popularity in recent years. Modern DevOps paradigms encourage building robust applications by incorporating automation, Infrastructure as Code, and agile development. To assess the health and “robustness” of IT systems, engineering teams typically use logs, metrics, and traces, which are used by various developer tools to facilitate observability.

Mark Settle on IT Leadership In 2021

The year 2020 was uniquely challenging for business and IT leaders around the world. The sudden shift en masse to remote work put tremendous pressure on IT teams to pivot and keep the show running for business continuity. Going digital is no longer a debate and digital transformation became more than a project in the distant future. So what else has changed in the IT leader’s playbook? We spoke with veteran CIO and author Mark Settle.