Operations | Monitoring | ITSM | DevOps | Cloud


The latest News and Information on Monitoring for Websites, Applications, APIs, Infrastructure, and other technologies.

IT Operations in 2023: AI/ML & Automation Will Continue to Be the North Star
The use of statistics, advanced algorithms and AI/Ml is becoming omnipresent. The benefits are visible in every walk of life, from web searches, to movie and retail recommendations, to auto-completing our emails. Of course, not many anticipated the dramatic entrance of generative AI in the form of ChatGPT for writing college essays and poetry on arcane topics.

Use Canvas panels to customize visualizations in Grafana
The Canvas panel, which will be Generally Available in Grafana 10, combines the power of Grafana with the flexibility of custom elements. Canvas visualizations are extensible, form-built panels you can use to explicitly place elements within static and dynamic layouts. This empowers you to design custom visualizations and overlay data in ways that aren’t possible with standard Grafana panels, all within Grafana’s UI.
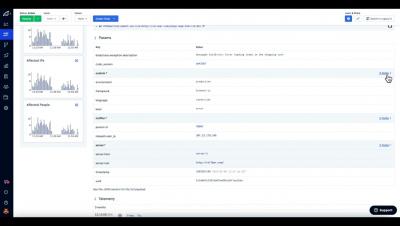
Rollbar Item Detail Overview and Usage

Monitor Your Applications Through New Relic via OpenTelemetry Over HTTP
As a big proponent of open source and all things open, I jumped at the opportunity to expand on Cribl Stream’s OpenTelemetry implementation. I’m happy to report that as of Cribl Stream 4.1, both our OpenTelemetry source and destination now support OTLP over HTTP!
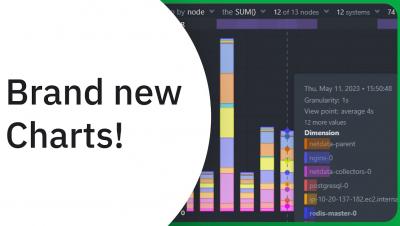
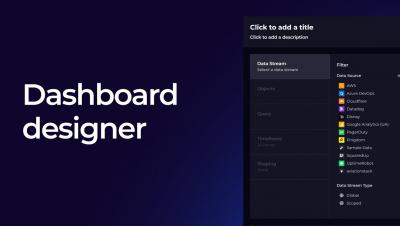
Introducing Charts v3.0: Slice, dice, filter and pivot the data in any way possible!

Datadog's shocking bill of $65 million, pricing comparison of SigNoz with other tools - SigNal 24

How Monitoring as Code Reduces the Time to Detect and Resolve Issues
A web application or an API breaking is a matter of when, not if. Whether the cause is buggy code making it to production or infrastructure failing to support the software built upon it, incidents of varying severity are the norm rather than the exception, appearing frequently enough that the industry has coined the terms Mean Time To Detect (MTTD) and Mean Time To Recovery (MTTR).

Overcoming Kubernetes Monitoring Challenges with Observability
At Logz.io, we’re seeing a very fast pace of adoption for Kubernetes–at this point, it’s even outpacing cloud adoption, with companies running on-prem fully adopting Kubernetes in production. Why are companies going in this direction? Kubernetes provides additional layers of abstraction, which helps create business agility and flexibility for deploying critical applications. At the same time, those abstraction layers create additional complexity for observability.

Three Ways to Make the Most out of Honeycomb Metrics
A while ago, we added Metrics to our observability platform so teams could easily see system information right next to their application observability data—no tool or team switching required. So how can teams get the most out of metrics in an observability platform? We’re glad you asked! We had this conversation with experts at Heroku. They’ve successfully blended metrics and observability and understand what is most helpful to know.