The latest News and Information on Log Management, Log Analytics and related technologies.
Being able to easily monitor the health of all your sites and services from multiple global locations is a powerful tool for site reliability. However, no one wants to sit and stare at a status dashboard all day. Naturally, teams want to be alerted when there is an issue. We can do that with alerting in Kibana. And when coupled with Elastic machine learning, alerts can be automatically generated from anomalies that are automatically detected. That’s the power of Elastic Observability.
We examined best practices for logging in a prior series. However, how can you apply those best practices in real life? Let’s dive into how you could use LogDNA in an opinionated manner to utilize best practices to bring value to your DevOps-focused projects. How can we ensure we follow best practices and keep our logs secure and compliant as noted in the previous series? Let’s pretend we’re setting up centralized log management with LogDNA for a new team and project.
Security teams can’t defend what they can’t see. As organizations move more workloads to the cloud, security teams need added visibility into these new workloads or risk having blind spots that lead to compromise. In the first installment of our "Getting Data In" webinar series, "Modernizing your SOC for the Cloud Age Starts with Security Foundations," we demonstrate how to quickly and easily onboard data into Splunk Cloud.
Logs in continuous delivery pipelines are often entirely ignored, right up until something goes wrong. We usually find ourselves wishing we’d put some thought into our logs, once we’re in the midst of trawling through thousands of lines. In order to try to prevent this, we can add DevOps metrics into our logs, which will provide us with greater observability, and give insight into anything going wrong in our pipelines.
Elastic Cloud recently introduced full FedRAMP authorization at the Moderate Impact level on AWS GovCloud (US). This brings the speed, simplicity, and security of Elastic Cloud to federal organizations and other customers in highly regulated environments. If you're a new or existing user who handles data for a US federal, state, or local government entity — or an educational institution — you can sign up for Elastic Cloud on AWS GovCloud (US) today.
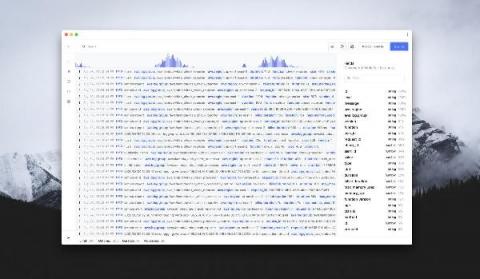
My latest product Apex Logs is now in open beta! Apex Logs is a structured and plain-text log management solution, with a minimal design, simple API, a rich query language, and flexible alerting integrations. On top of that Apex Logs currently has the most competitive pricing in the industry, up to 10 times more cost-effective than the offerings from Papertrail, Loggly, DataDog, and others at only $0.40/GB (ingested). Let’s take a look!
As more organizations move to the cloud, the volume of machine generated data has grown exponentially and is increasingly important for many teams. Software engineers and SREs rely on logs to develop new applications and troubleshoot existing apps to meet reliability targets. Security operators depend on logs to find and address threats and meet compliance needs. And well structured logs provide invaluable insight that can fuel business growth.
Being able to visualize the logs from your infrastructure is crucial - both for identifying potential issues and identifying opportunities for improving performance and utilization. However, when it comes to SCOM and Azure, monitoring can be a bit confusing. That is why, we at SquaredUp, have made it our mission to help you make sense of all the data being collected with beautiful visualizations and dashboards that can be shared with the rest of your organization and displayed on wallboard monitors.