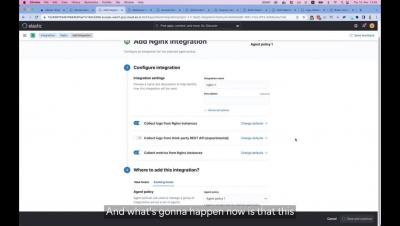
Operations | Monitoring | ITSM | DevOps | Cloud

Logging

The latest News and Information on Log Management, Log Analytics and related technologies.

End-to-End Observability Drives Great Digital Experiences

Mike Cohen, Splunk’s head of product management for network monitoring, joins theCube’s John Furrier for a conversation about how networks are an untapped source of data to help your organization achieve observability — and how to unlock that potential. Why understanding data flow and service interactions is key to understanding your systems Why distributed systems can cause extra troubleshooting issues — and what you need to know to fix them through network performance monitoring

Keeping Watch Over Microservices and Containers

Splunk Director of Product Management Craig Hyde joins theCube’s John Furrier for a conversation in the Leading With Observability series. They discuss the importance of digital experience monitoring, especially as the world sees a boom in remote, online business and increasingly complex technological infrastructures. Why starting with the end user in mind is critical for setting observability goals How full-fidelity end-end tracing impacts troubleshooting, to detect and alert in seconds

Under the Hood With Splunk Observability

Splunk Distinguished Architect Arijit Mukherji joins theCube’s John Furrier for a conversation about the value of having a holistic view of observability — and the right solutions — to help you achieve your business goals. Signs that your tool sprawl is becoming a big problem in dealing with the inherent complexities of modern IT environments Why full-fidelity ingest can be an observability superpower How real-time streaming analytics can improve MTTI and MTTR

Network Observability for Distributed Services

Mike Cohen, Splunk’s head of product management for network monitoring, joins theCube’s John Furrier for a conversation about how networks are an untapped source of data to help your organization achieve observability — and how to unlock that potential. Watch this segment of Leading With Observability on theCube to learn about addressing the gaps in your visibility, including: The ins and outs of monitoring metrics, distributed tracing and correlating logs with no management complexity

Key Kubernetes Metrics and Resources to Monitor for Peak Cluster Performance

Monitoring is not easy. Period. In our guide to Kubernetes monitoring we explained how you need a different approach to monitoring Kubernetes than with traditional VMs. In this blog post, we’ll go into more detail about the key Kubernetes metrics you have access to and how to make sense of them. Kubernetes is the most popular container orchestrator currently available. It’s available as a service across all major cloud providers. Kubernetes is now a household name.

Logz.io and the AWS Distro for OpenTelemetry

Amazon Web Services has announced enhanced support for the open-source distribution of the OpenTelemetry project for its users. AWS Distro for OpenTelemetry (ADOT) now includes support for AWS Lambda layers for the most popular languages and additional partners integrated into the ADOT collector. And one of those partners is Logz.io! Logz.io is happy to announce that our exporter is now included in the AWS Distro for OpenTelemetry.

How to Improve Kubernetes Management and Administration with LogDNA

In this video, we will show how LogDNA helps DevOps teams using Kubernetes to consume, control and collaborate with logs. By providing value to data from every source, including Kubernetes, developers are empowered to leverage logs to ensure they can continue to accelerate development cycles, and Ops teams can easily onboard microservices teams without the need to modify their infrastructure.

The essentials of central log collection with WEF and WEC

Last week we covered the essentials of event logging: Ensuring that all your systems are writing logs about the important events or activities occurring on them. This week we will cover the essentials of centrally collecting these Event Logs on a Window Event Collector (WEC) server, which then forwards all logs to Elastic Security.

Using Coralogix to Gain Insights From Your FortiGate Logs

FortiGate, a next-generation firewall from IT Cyber Security leaders Fortinet, provides the ultimate threat protection for businesses of all sizes. FortiGate helps you understand what is happening on your network, and informs you about certain network activities, such as the detection of a virus, a visit to an invalid website, an intrusion, a failed login attempt, and myriad others. This post will show you how Coralogix can provide analytics and insights for your FortiGate logs.

Searching through logs with the free and open Logs app in Kibana

Log exploration and analysis is a key step in troubleshooting performance issues in IT environments — from understanding application slow downs to investigating misbehaving containers. Did you get an alert that heap usage is spiking on a specific server? A quick search of the logs filtered from that host shows that cache misses started around the same time as the initial spike.