Operations | Monitoring | ITSM | DevOps | Cloud
The latest News and Information on Log Management, Log Analytics and related technologies.
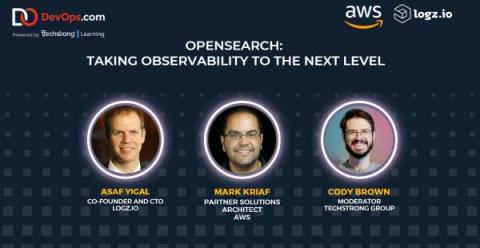
OpenSearch and Logz.io - Taking Observability to the Next Level
If you’re in the cloud engineering and DevOps space, you’ve probably seen the name OpenSearch a lot over the last couple of years. But, what is your current understanding of OpenSearch, and the components around it? Let’s take a closer look.
Splunk's Purpose
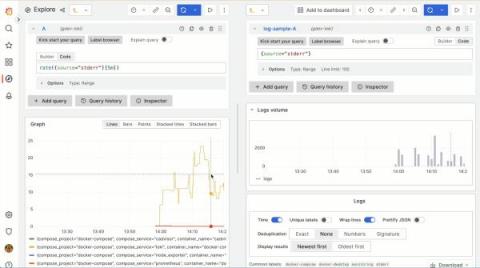
Write Loki queries easier with Grafana 9.4: Query validation, improved autocomplete, and more
At the beginning of every successful data exploration journey, a query is constructed. So, with this latest Grafana release, we are proud to introduce several new features aimed at improving the Grafana Loki querying experience. From query expression validation to seeing the query history in code editor and more, these updates are sure to make querying in Grafana even more efficient and intuitive, saving you time and frustration.
Ingesting Google Cloud Audit Logs Into Graylog
We will focus on the audit logging of Google cloud itself, however, the input supports the below sources when it refers to Google Cloud Logs.
Tips and best practices for Docker container management
How Can You Optimize Business Cost and Performance With Observability?
Businesses are increasingly adopting distributed microservices to build and deploy applications. Microservices directly streamline the production time from development to deployment; thus, businesses can scale faster. However, with the increasing complexity of distributed services comes visual opacity of your systems across the company. In other words, the more complex your system gets, the harder it becomes to visualize how it works and how individual resources are allocated.
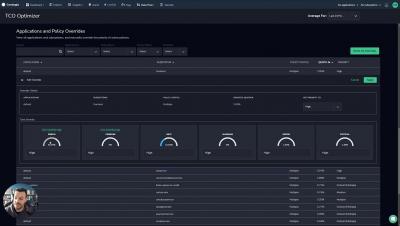
Coralogix Deep Dive - How to Save Between 40-70% with the TCO Optimizer
Java Logging Frameworks Comparison: Log4j vs Logback vs Log4j2 vs SLF4j Differences
Any software application or a system can have bugs and issues in testing or production environments. Therefore, logging is essential to help troubleshoot issues easily and introduce fixes on time. However, logging is useful only if it provides the required information from the log messages without adversely impacting the system’s performance. Traditionally, implementing logging that satisfies these criteria in Java applications was a tedious process.
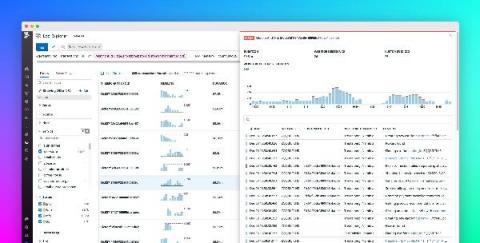
Analyze causal relationships and latencies across your distributed systems with Log Transaction Queries
Modern, high-scale applications can generate hundreds of millions of logs per day. Each log provides point-in-time insights into the state of the services and systems that emitted it. But logs are not created in isolation. Each log event represents a small, sequential step in a larger story, such as a user request, database restart process, or CI/CD pipeline.


