Operations | Monitoring | ITSM | DevOps | Cloud

Latest Videos

Turning log anomalies into log alerts | LogicMonitor Envision

In this demo, discover how LogicMonitor Envision's anomaly detection helps your IT team stay ahead of issues before they escalate. By analyzing every log event, Envision identifies and marks new patterns as anomalies, ensuring your team is notified when something unusual happens. This capability, combined with unified logs and metrics, provides the context you need to make faster, smarter decisions about your network's performance and health.

SecureSense Lite Temperature Monitoring Solution by | Seqwence Systems | Zebra

Discover SecureSense Lite, the advanced temperature monitoring software by Seqwence Systems. Designed to work seamlessly with Zebra Technologies' ZS300 datalogger. This powerful solution enables real-time tracking and monitoring of critical temperature-sensitive environments, ensuring your temperature sensitive assets are protected with precision and ease. Whether it's for healthcare, logistics, or food storage, SecureSense Lite combine with Zebra's ZS300 datalogger deliver reliable performance to safeguard your operations.

Faster APIs, Better Experiences: Debugging Next.js to slash API Load Times with Dan Mindru

From sluggish API calls to elusive bugs, debugging your Next.js application doesn’t have to mean hours of staring at logs and deciphering dashboards. Join Dan Mindru, co-host of the Morning Maker show, as he shows you how to debug errors and performance issues using Sentry’s Tracing and Session Replay. We’ll start by diving into API performance optimization, where you’ll learn to identify and fix bottlenecks efficiently. Next, see a live demo of how Dan uses tracing and session replay to capture and replay user sessions to fix issues across their stack.

[Workshop] Fix Your Front-End: JavaScript Edition

Hear from the team behind our JavaScript SDKs as they share practical tips to make debugging more tolerable. In this session we covered: Setting up and configuring Sentry for frontend projects How to trace frontend errors back to backend issues Analyzing web vitals to identify performance bottlenecks Using session replay for better user insights.

Introduction to The Splunk Terraform Provider | Create a Detector in Splunk Observability Cloud

In this video I will demonstrate how to use the Splunk Terraform Provider. I’ll explain what it is and why you should use the Splunk Terraform Provider as part of your overall Observability as Code solution. Using a simple Terraform project, I will walk you through the setup of the provider and the creation of a Detector in Splunk Observability Cloud.

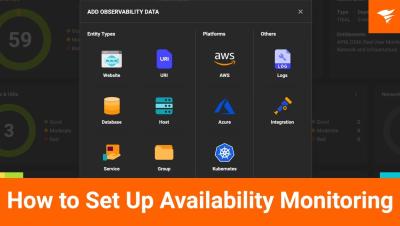
How to Set Up Availability Monitoring in SolarWinds Digital Experience Monitoring

Learn how to set up availability monitoring in SolarWinds Observability Platform’s Digital Experience Monitoring (DEM). This tutorial walks you through configuring synthetic probes, setting up website monitoring, adjusting test intervals, and enabling SSL certificate monitoring. Follow along to ensure your website stays available and catch issues before your users do!