Operations | Monitoring | ITSM | DevOps | Cloud

Latest News

The Age of Service Mesh

You have built a massively successful system. The users just can't get enough and request new features. Your developers crank out new services on a regular basis. Your DevOps/SRE team configures and scale your Kubernetes cluster (or clusters). As the system becomes more complicated and sophisticated you realize that there are common themes that repeat across all your services.

Grafana Templates for Elasticsearch, Prometheus and InfluxDB

Grafana is everywhere. Almost every DevOps team out there is currently in the process of creating a proof of concept enabling them to implement Grafana into their stack—if they have not already implemented it, that is. Teams are eager to employ Grafana’s highly effective visualizations and dashboards that monitor and track services’ functionality and performance.

October 2019 Social Media Outages by Uptime.com

This past month was haunted with social media outages, finance, and tech services. DDoS attacks affected entire countries and broadband services in Africa. We’re continuing to see a pattern of outages from social media services with multiple applications. When one of these apps goes down, at least one of the others usually goes as well. The worst of these outages occurred in March, when Facebook’s entire suite of apps went down.

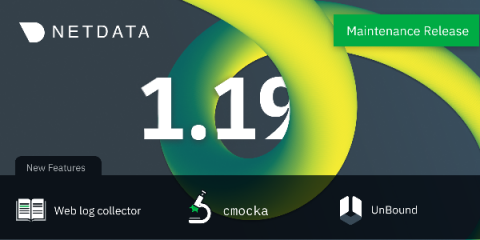
Release 1.19: More efficient DevOps with web log parsing and unit testing

Network monitoring is complex, which is why we’re developing a monitoring tool that will drastically increase DevOps productivity. This release is all about improving Netdata’s day-in, day-out performance. We’re working hard to make deploy enhancements that help engineers make faster, smarter decisions about their systems.

A humble and sincere 'thank you' to our open source community

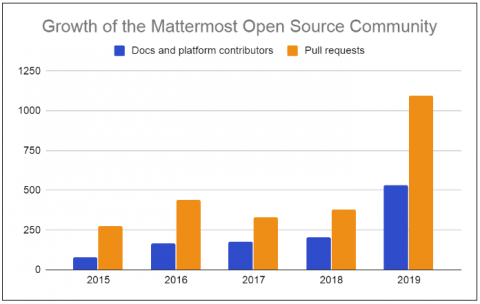
Since our inception, open source contributions have been integral to our business and success. This October, as we participated in the great Hacktoberfest event, organized by Digital Ocean and hosted by GitHub and this month as we host our own hackathon event, we reflect upon and appreciate our community.

Top 9 WebLogic Performance Metrics to Monitor

Oracle WebLogic Server (WLS) is one of the leading Java Enterprise Edition (Java EE) application servers in the market today. Offering a robust, mature, and scalable implementation of the J2EE specification, the WebLogic Platform is a unified, extensible platform for developing and deploying applications based on Service-Oriented Architectures (SOA).

Why I'm Grateful For Our Observability Community

It’s that season, when we take time to consider what we’re grateful for and extend thanks to those we value and the experiences we treasure. One special aspect of America’s Thanksgiving holiday is the inclusiveness of celebrating across all communities and simply sharing, taking time to enjoy the fruits of the land. Giving thanks in late November can bring some fulfillment, but it should also be a reminder that we need to practice gratitude more regularly.

KubeCon 2019 Ushers in New Era for Container Adoption and Maturity

Last week’s container event of the year, KubeCon, hosted by the Cloud Native Computing Foundation, attracted more than 12,000 attendees to the San Diego convention center. While there, I attended numerous sessions but I also spent a good portion of time chatting with DevOps professionals, Kubernetes practitioners, and vendors to understand the practicalities behind deploying and managing containerized workloads and microservices.