The latest News and Information on Monitoring for Websites, Applications, APIs, Infrastructure, and other technologies.
How a US-based consumer goods company reduced ticket count related to performance issues on macOS devices using Chrome as part of their digital collaboration platform. Thanks to digital collaboration tools, the world continues to evolve and accept new hybrid working styles. Today, reliance on these instant messaging, video calls, and conferencing tools has turned collaboration solutions into the lifeblood of modern business productivity and collaboration.
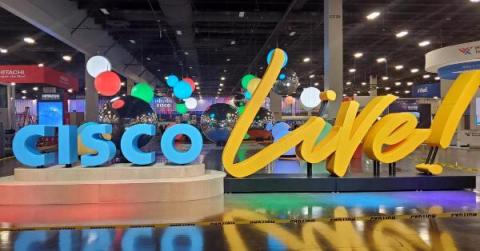
It was really great to see so many old friends again at Cisco Live this year in Las Vegas. It’s been a few years since I’ve been to a conference other than a few small work events, so it was exciting to wander the World of Solutions, talk to people at the many booths, and bump into people I knew online but never met in person.
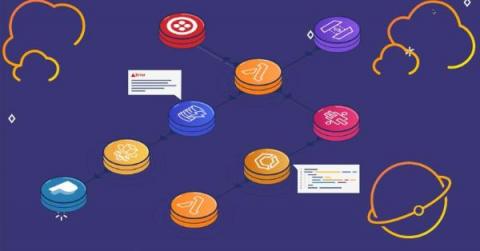
It’s no secret that AWS has an extensive catalog of services which enable organizations to rapidly scale infrastructure. In this fast paced and self scaling cloud native world, observability across all these services has never been more critical. As a long time AWS Technology Partner, it’s always great to speak to our friends at AWS, and most recently, Lumigo CEO Erez Berkner joined AWS on Air to talk about end-to-end observability of the modern cloud application.
It’s common for most CISOs to lead off a security conversation by comparing what other companies in the industry are spending on cybersecurity and simply matching that. After all, regardless of the results, the CISO can always tell the board of directors they’re following industry guidelines around security budgets. The problem is security outcomes are bad regardless of budgets. It’s not what you spend. It’s the results you get that matter.
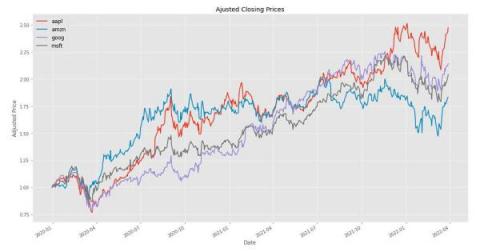
A time series is a sequence of data points (observations) arranged chronologically and spaced equally in time. Some notable examples of time series data are stock prices, a record of annual rainfall, or the number of customers using a bike sharing app daily. Time series data exhibits certain patterns, such as the highs and lows of hotel prices depending on season.
Besides keeping IT and business systems humming, IT operations teams are tasked with driving digital transformation initiatives and supporting innovation within their organizations.
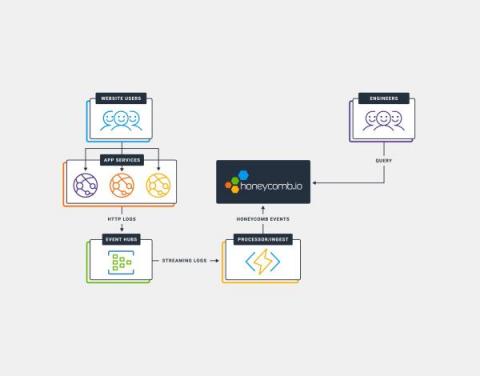
Debugging application performance in Azure AppService is something that’s quite difficult using Azure’s built-in services (like Application Insights). Among some of the issues are visualizations, and the time it takes to be able to query data. In this post, we’ll walk through the steps to ingest HTTP Access Logs from Azure AppService into Honeycomb to provide for near real-time analysis Access Logs.
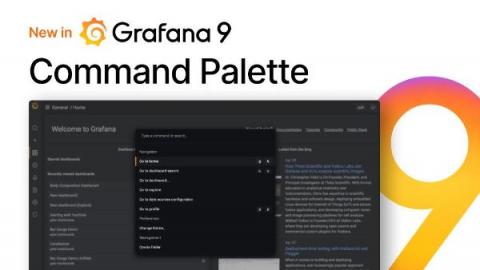
Grafana is an open source tool for people with many different perspectives and various skill levels. Many initiatives to improve the Grafana user experience start by thinking about someone who’s just getting started on their observability journey. However, late last year, a Grafana Labs hackathon team looked to improve the user experience for our power users by introducing a command palette to Grafana.
Earlier this month, we shared exciting news with our first placement in the 2022 Gartner® Magic Quadrant™ for Application Performance Monitoring and Observability: we are in the Visionary Quadrant. This research is near to my heart, as I led this research for four years; so, I wanted to reflect on why this is an accurate placement for Logz.io. The Visionary Quadrant is designated for those organizations who are pushing the boundaries of a specific market and technology.