Introducing Orchestral.ai
Introduction to Orchestral.ai, a company committed to making Autonomous Infrastructure a practical reality.


The latest News and Information on Monitoring for Websites, Applications, APIs, Infrastructure, and other technologies.
LogSnag is the new kid on the block, but we bet that it will become relevant in this space soon. Today we will show you how to monitor outages and get alerts for your third-party services within LogSnag. What is LogSnag? Here's the intro, but you can learn more at LogSnag official website.
Food retailers reduce the workload accumulated by their IT areas by almost 30% thanks to monitoring. Controlling data and extensive information from the whole company, by controlling, supervising and ordering everything through the same system, allows to reduce the times of action in the face of possible errors and failures, improves resource management and organization and increases the effectiveness of the business activity. In addition, monitoring saves costs.
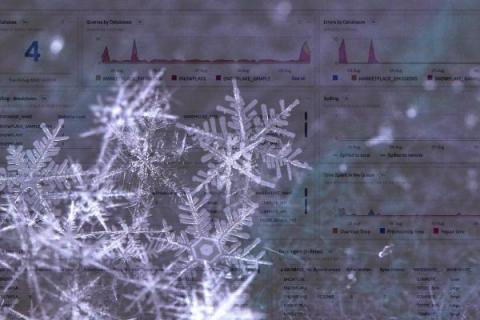
You’ve probably heard something like this before: “It’s a managed service! We don’t need to worry about anything!” But when it comes to your production workloads, database monitoring is imperative. With the new Snowflake Dashboards and Detectors in the Splunk Observability Content Contributors repository you can start seeing the details of individual Snowflakes.
Microsoft Azure’s recently launched new Azure Virtual Machines (VMs) feature the Ampere Altra Arm-based processor. These new VMs are engineered to efficiently run horizontally scalable workloads such as web servers, application servers, and open source databases. They deliver excellent price-performance and represent an important addition to Microsoft Azure's portfolio of instance types.
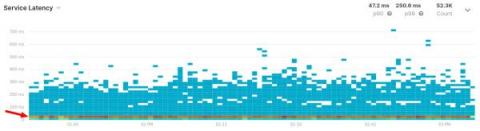
Your liveness and readiness HTTP endpoints can generate a bunch of useless Spans and can mess with your latency metrics. On this post we’ll learn how to configure Kamon Telemetry to completely ignore these enpoints for good.
Someone once described dashboards to me as “expensive TV for software engineers.” At first, I stood there quietly shocked—dashboards had informed many root cause analyses (RCAs) in my life as a developer.
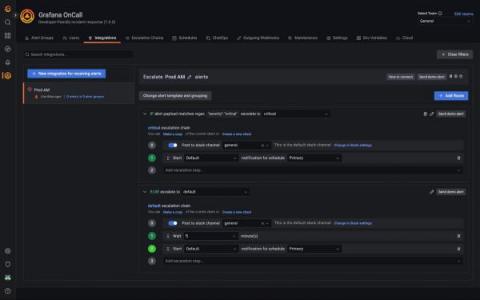
Managing on-call schedules and escalation chains, especially across many teams, can get cumbersome and error prone. This can be especially difficult without as-code workflows. Here on the Grafana OnCall team, we’re focused on making Grafana OnCall as easy to use as possible. We want to make it easier to reduce errors with your on-call schedules, create schedule and escalation templates quickly, and fit on-call management into your existing as-code patterns.