Operations | Monitoring | ITSM | DevOps | Cloud

The latest News and Information on Monitoring for Websites, Applications, APIs, Infrastructure, and other technologies.

What's in Store for NetOps in 2023?

There are many factors making networking both more complicated and more critical than ever. The advent of cloud infrastructure, web-based applications, and increasingly diverse network environments demand a new approach to network operations, or NetOps, as it’s referred to in the industry. Networks are bigger than ever: they now connect everything ranging from automobiles to cloud servers.

Catchpoint Announces the World's First Complete Solution to Monitor and Protect the Internet's Leading Companies from BGP Incidents in Seconds

Catchpoint's Internet Performance Monitoring Platform helps IT teams identify and mitigate BGP incidents, including hijack attempts and routing issues, with the industry's broadest network of vantage points in the world drawing on real-time BGP monitoring.

Introducing Levitate: 'uplifting' your metrics woes because self-management sucks like gravity

Managing your own time series database is painful. We’ve moved from servers to services, and yet, monitoring metrics data is primitive. Our managed time series database powers mission-critical workloads for monitoring, at a fraction of the cost.

The Hidden Costs of Logging and What can Developers Do About It?

With the growing adoption of remote and distributed application development including micro-services, cloud-native applications, serverless, and more, it is becoming challenging more than ever before for developers to troubleshoot issues within a reasonable time, and that is a bottleneck. That in a sense contradicts the objectives of Agile and DevOps through fast feedback loops, continuous delivery, quick MTTR (mean time to resolution of defects), etc.

Why SREs need better visibility, not more tools

As a site reliability engineer (SRE), you juggle a lot of moving targets. You keep tabs on your operational environment’s health and maximize service levels, all while trying to scale your business and exceed client expectations. To hold it all together, you’ve likely implemented a hybrid cloud strategy to keep a watchful eye over everything: your on-premises infrastructure, containers, and numerous cloud deployments.

Custom Preferences in Sematext

Sematext Cloud is a monitoring and log analysis platform that provides tools for monitoring and analyzing the performance and logs of your infrastructure, applications, and services. Custom preferences allow you to customize your UI in the Sematext Cloud. Customize the Default color scheme for your charts and graphs in reports, Change between 12 and 24-hour formats, and change from the light theme to the dark theme. (One of the most requested features from our users)

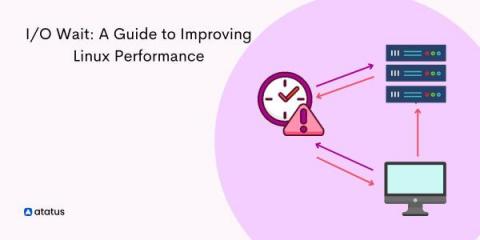
I/O Wait Time: A Guide to Improving Linux Performance

I/O wait is a plaguing issue in Linux. Speaking in layman terms, I/O wait is the time taken by the processor (here, CPU) to complete an input service request. Ideally, our CPU doesn't seem to do any work when it is processing one input request at a time, thus the duration between your input and the output provided by the system can be treated as the I/O wait time.