

Operations | Monitoring | ITSM | DevOps | Cloud

Sponsored Post

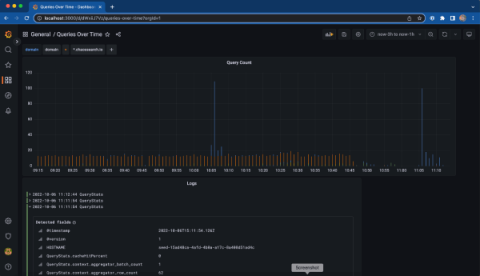
Tutorial: How to Use ChaosSearch with Grafana for Observability

In my last blog post, Building a Cost-Effective Full Observability Solution Around Open APIs and CNCF Projects, we introduced using ChaosSearch in combination with the most popular open source front- and back-ends in the application observability space. In case you missed it, the TL;DR version is that you can use a variety of open source projects and open API-based components to build the best-of-breed observability stack of your choice rather than relying on expensive, all-in-one solutions.

The new APM experience: every service monitored from day one, and ready for your AI agent

Coralogix APM has told you which service is behind the latency. From today, the new APM experience tells you what is behind the service: the release, the environment, or the query one layer down. It watches every service you run from the moment it appears, without anyone writing an alert. And everything you see on the screen, your AI agent can use too: in Olly, from the Coralogix CLI, or through MCP in your IDE. A latency chart shows that something got slow.

Latest Log Management Strategies in 2026: From Raw Logs to Business Value

Discover the latest log management strategies for 2026 and learn how AI and automation turn raw logs into actionable insights. See how modern log management can reduce investigation time, improve incident response, control costs, and strengthen visibility across hybrid and multi-cloud environments.

Cribl On Your Coffee Break Episode 20 - Keep learning, keep growing, keep Cribl-ing!

As we wrap up our month-long series, we look at the resources that will help you keep learning and growing - from Cribl University to Sandboxes to the Cribl Community and beyond. By the time the month is over, you will have a pretty good idea of what Cribl can do, and how to do it. You’ll also have consumed more caffeinated beverages than is strictly appropriate...

EU data residency for Hosted OpenSearch on Logit.io

EU buyers asking for Hosted OpenSearch with data residency usually mean something precise: indexes and cluster storage should land in a European data centre that lines up with GDPR expectations and the geography named in the DPA — not a US default that security later has to unwind. On Logit.io that choice is an account-level data storage region, not a free toggle on every stack. Get the first stack right and every later OpenSearch or log stack in that account follows.

Cribl On Your Coffee Break Episode 19 - A Cribl Grab bag: Guard, API/SDK, Insights, and FinOps

In our penultimate episode of the series we try to hit all the things that didn’t fit anywhere else - Cribl Guard, the API/SDK, Insights, and the FinOps center. By the time the month is over, you will have a pretty good idea of what Cribl can do, and how to do it. You’ll also have consumed more caffeinated beverages than is strictly appropriate...

Tech Talk #15 - How VictoriaLogs Go Fast

Go is fast because of decisions most engineers never see. Jesus walks through how VictoriaMetrics uses Go to process logs at scale, the tradeoffs behind those choices, and what breaks if you get them wrong. If you write Go or run log pipelines, this is 30 minutes worth blocking your calendar for. Resources for Further Learning.

ITSM to Deep Observability with ServiceOps & ObserveOps | Motadata Webinar

In this webinar recording, discover how ServiceOps and ObserveOps connect IT service management with deep observability. Learn how IT teams can identify root causes faster with unified visibility across incidents, metrics, logs, traces, applications, and infrastructure. Don't forget to like, share, and subscribe for more insights on ITSM, observability, AIOps, and IT operations.

What is data mesh architecture? Data mesh vs. data fabric vs. data lake [Quick Question Ep. 1]

What is data mesh architecture, and how does it compare to data fabric and data lake? In this episode of Quick Question, we explain how data mesh connects distributed data sources without duplication or centralization, keeping data at its original location while giving authorized users secure, low-latency access, even in mission-critical and bandwidth-constrained environments.

Find answers in your logs faster with Datadog's Tap to Parse

Logs are easiest to investigate when the values that matter are already captured as attributes. When those values are buried in a log message, even a straightforward question such as filtering on a status code, graphing the duration of a request, or following a unique transaction across a set of logs requires writing complex regular expressions or Grok patterns.

Deduplicate logs at the edge: Same insights, a fraction of the volume

Ask a platform team why their observability bill keeps growing and you'll often get a one-sentence answer: And that's usually where it ends. The application teams own the log output, the platform team owns the bill, and nobody has the leverage to change what gets emitted. A single retry loop can print the same error thousands of times a minute. Every one of those lines is ingested, indexed, and stored. You pay for all of them, and they tell you exactly one thing: this error happened, a lot.

Cribl On Your Coffee Break Episode 18 - All About AI

With 3 more days to go, we’ve finally arrived at the AI episode in the Cribl on your coffee break series. Today we’ll touch on a few of the many ways we’ve enabled Cribl to use AI, and also to help you manage the data generated by AI-enabled tools. By the time the month is over, you will have a pretty good idea of what Cribl can do, and how to do it. You’ll also have consumed more caffeinated beverages than is strictly appropriate...

Inputs Demystified - Connect Anything with the Input Wizard Webinar

Getting logs into Graylog should not require a PhD in syslog. Part of the Getting the Most out of Graylog Open series, this session educates Open users on the full Inputs framework in Open, what input types are available, when to use each, and how to use the Input Wizard to get new sources connected faster. Open users need to be on the latest version of Graylog. We also cover the revamped Inputs page and how to validate that your data is arriving clean.

Cribl On Your Coffee Break Episode 17 - Notebooks

Whether you call them runbooks, response guides, or just notebooks, today on Cribl on your coffee break, we are looking at Cribl’s implementation, which lets you document your notes, queries, and discoveries as you make them, and then re-run those same processes later to troubleshoot similar issues in the future with less toil. By the time the month is over, you will have a pretty good idea of what Cribl can do, and how to do it. You’ll also have consumed more caffeinated beverages than is strictly appropriate...

Tame the data chaos with Sumo Logic's Data Pipelines

Security and operations teams are collecting more telemetry than ever, and AI is accelerating that curve. IDC projects the world will generate 393.9 zettabytes of data in 2028, up from 149 zettabytes in 2024, with AI and machine learning workloads driving much of that growth. That growth forces a hard trade-off. Ingest everything, and you pay for it. Filter aggressively, and you risk missing the signal that matters.

Cribl On Your Coffee Break Episode 16 - Dashboards

Welcome to the final week of Cribl on your coffee break, the series to help you get started with the Cribl platform. Today we’re going to cover the last of the "essential skills” in the Cribl platform: using and building dashboards. By the time the month is over, you will have a pretty good idea of what Cribl can do, and how to do it. You’ll also have consumed more caffeinated beverages than is strictly appropriate...

Your Feedback Becomes the AI Agent's Memory: How OrionIQ AI Agents Learn From You

TL;DR: OrionIQ AI agents, available inside the logz.io platform, now learn from your feedback. Rate any agent run, thumbs up or thumbs down, say why, and the agent re-reads its own run, finds the decision behind the outcome, and writes a lesson. The next run of that agent in your account starts with the lesson in hand. It works for every OrionIQ AI agent, from Alert AI Analysis to scheduled and marketplace agents. Lessons never cross accounts or agents, and you control what the agent keeps.

Cribl On Your Coffee Break Episode 15 - Routes, part 4 and Cribl Packs

Welcome to the end of week 3 of series to help you get started with the Cribl platform. We’re still talking about routing, but through the lens of Cribl Packs, a way of supercharging your path to getting your data in and through Cribl. By the time the month is over, you will have a pretty good idea of what Cribl can do, and how to do it. You’ll also have consumed more caffeinated beverages than is strictly appropriate...

Log Analysis with Machine Learning: An Automated Approach to Analyzing Logs Using ML/AI

AI log analysis helps IT teams turn massive volumes of operational data into actionable insight. By applying statistical methods, machine learning (ML), semantic analysis, and generative AI, organizations can identify unusual behavior, connect related signals, and investigate probable root causes faster. But AI-generated answers should not be mistaken for proof.

Cribl On Your Coffee Break Episode 14 - Routes, part 3: One-to-Many

Welcome to the 14th installment in our series to help you get started with the Cribl platform. Here, we continue our conversation about Cribl routes and routing techniques By the time the month is over, you will have a pretty good idea of what Cribl can do, and how to do it. You’ll also have consumed more caffeinated beverages than is strictly appropriate...

Cribl On Your Coffee Break Episode 13 - Routes, part 2: Many-to-one

Leon is back from the BlackHat conference and it shows (or at least it SOUNDS like it). Despite a little bit of laryngitis, today he’s continuing the exploration of routing by focusing on taking multiple sources of data and using routes to send them to a particular destination. By the time the month is over, you will have a pretty good idea of what Cribl can do, and how to do it. You’ll also have consumed more caffeinated beverages than is strictly appropriate...

September 2026 at Bindplane: Bindplane Agent and a new Overview page

Also this month, a new BDOT 1.107.0 release, and you can start a configuration from a Full-Pipeline Blueprint. Here’s what happened in the last month. Prefer to watch? The September Community Call is streamed live on YouTube. Watch " YouTube" on YouTube Watch.

Bindplane Agent Is Here: Build, Edit, and Understand Pipelines in Plain Language

Pipeline Intelligence already recommends processors, reads live telemetry, detects log types, and generates processor bundles from natural language. But most of it lives inside a single processor node. You still have to know which one to open and what to ask for. This changes today. Bindplane Agent is your AI assistant inside Bindplane, ready to act on what you describe in plain language.

How backend functions extend Cribl Apps: Scheduling, local testing, and logs

See how backend functions extend Cribl Apps with live data retrieval, scheduled jobs, local testing, deployment validation, and logging. In this walkthrough, Giovanni Mola shows developers how to connect app data sources such as Jira and news feeds, manage schedules, preview functions locally, verify a live deployment, and inspect emitted logs in Cribl Search.

9 Best Log Management Tools and What They Cost

Most log management tools bill you on log ingestion, the volume of data you send them. That works until your log volume doubles, and the invoice doubles with it. The best log management tools let you control what gets indexed and kept, so growth stops being a budget problem. In this blog, you will see: By the end you will know which fits your volume. Log management is the full lifecycle of your log data, from the moment it is collected to the moment it is deleted.

Redact PII at the edge - and still be able to search for it

Ask a platform team why their application logs aren't in their observability backend and you'll often get a one-sentence answer: And, that's where the conversation ends. The logs stay in a silo. Or, they don't get collected at all. The team loses the troubleshooting signal, and nobody revisits the decision because the alternative looks like a compliance violation. Application logs in healthcare, aviation, insurance, and retail are full of personal information that should not be stored in plain text.

Log ingestion: you are probably paying to store logs you will never read

The default way to adopt log management is to ship everything and search it later. It is the path every vendor’s quickstart puts you on, and it is the reason log bills surprise people: ingestion is priced by volume, so“ship everything” is a spending decision disguised as a configuration default. The uncomfortable part is that most of that volume is never read. Nobody greps last Tuesday’s 200 OK access lines.

UK data residency for Hosted OpenSearch on Logit.io

Procurement teams asking for UK-hosted OpenSearch usually mean something concrete: indexes and cluster storage should land in a UK data centre, not wherever a vendor’s default region happens to be. On Logit.io that choice is an account-level data storage region, not a free toggle on every stack. Get the first stack right and every later OpenSearch or log stack in that account follows. Get it wrong after go-live and you are looking at a second account, not a silent migrate button.

Agentic Operations Start with Context: Build the Right Data Foundation

Episode 1, "Beyond the Thread: Deconstructing the Cisco Data Fabric Powered by the Splunk Platform," explores the intersection of data strategy and operational efficiency. Hosted by Splunk's Courtney Wright, the session features insights from experts Keith McClellan and Michael Sondag on the complexities organizations face in data management and operational models.

Assisted, Augmented or Agentic? Choose Your Splunk Starting Point

Episode two of Beyond the Thread explores how organizations can leverage a solid data foundation for AI-driven actions. Hosted by Courtney Wright and featuring experts Greg Ainsley-Malik and Sonal Pardeshi, the discussion delves into the Cisco Data Fabric, powered by the Splunk platform, and its role in transforming machine data into actionable insights. The episode highlights the journey towards agentic operations, addressing the challenges faced in moving from AI-ready data to effective implementations, and examines different adoption strategies that organizations may pursue.
How to extract structured fields from unstructured logs

If you’ve spent any time digging for insights in logs, you know the shape of the problem. A single log line might contain an IP address, a status code, a response time, and a user ID, but it’s all buried in one long, unstructured string. You know the information is there. Getting it into a field you can filter, group, or chart on is a different matter.

Log Filtering: How to Cut Log Ingest Volume Without Losing Evidence

Every log estate reaches a point where volume grows faster than the value inside it. The usual response is to find the biggest source and drop it. Cutting volume is the easy part. Cutting the right half takes judgment. Log filtering is only one of four options for an expensive source, and the other three matter just as much. In this blog, you will: By the end you can defend every rule you write, including the ones that keep data. A volume cut fails in two directions.

Automate Product Analytics reports with your agent and the CX CLI

Every page view, click, and session your RUM SDK captures lands in Coralogix as a log event under the cx_rum subsystem — the raw data behind how people actually use your product. You can turn it into a shareable report without writing a single query. Just ask your coding agent. Your agent queries that data through the CX CLI and writes the report for you: describe what you want in plain English, get a formatted report back — without leaving the terminal.

Cribl On Your Coffee Break Episode 4 - Gathering REST data

In the 4th installment of our series, Leon looks at Cribl’s ability to collect REST API data. By the time the month (and the series) is over, you will have a pretty good idea of what Cribl can do, and how to do it. You’ll also have consumed your body weight in caffeinated beverages...

The pager shouldn't be what starts the investigation

Authored by Greg Janco, Engineering Manager at Mezmo I've always thought there was something backwards about incident response. An alert fires at 3 a.m. PagerDuty does its job. Somebody wakes up, grabs a laptop, connects to the VPN, opens the alert, and then starts answering the same basic questions we ask at the beginning of almost every incident. What changed? What else is broken? Have we seen this before? Some of those need a human eventually. A lot of the first pass doesn't.

6 Signs a Dedicated Log Tool Fits Better Than a Full Observability Platform

Most growing teams eventually consolidate onto a full observability platform, and for teams correlating logs, metrics, and traces across a complex system, that’s often the right call. But a dedicated log tool still wins for a specific set of teams: ones that need to move fast, keep costs simple, and get real answers from logs without carrying the weight of a platform they don’t fully need yet. Here’s when that’s you.

PII Redaction in Logs: Mask, Redact, Hash, or Drop?

Sensitive values reach your logs without anyone deciding they should. A debug line prints a whole request object. An error message carries the query string. A customer email address is suddenly stored in three systems. PII redaction in logs then gets treated as one setting to switch on. In practice it covers four separate treatments. The value is already inside the message before log ingestion finishes. In this blog, you will: By the end you can write a rule for each field and defend it.

Log Processing: What Happens to a Log Line Before You Can Search It

A log line arrives as plain text and leaves as a record you can query. Six steps sit between those two states. Each one adds something useful, and each one costs you time, CPU, or storage. Most teams never look at that chain until a search comes back empty. Here is what log processing does to an event, step by step: By the end you can look at your own chain. You will know what each step buys you. Six steps turn a raw log line into a searchable record.

Cribl On Your Coffee Break Episode 3 - Configuring Prometheus Remote-Write

In day 3 of our coffee break series, Leon continues to explore common observability data types and how to get them into Cribl. Today, we’ll look at setting up a simple Prometheus ingestion. By the time the month (and the series) is over, you will have a pretty good idea of what Cribl can do, and how to do it. You’ll also have consumed your body weight in caffeinated beverages...

The six pillars of AI-ready telemetry

“AI-ready” is everywhere right now, attached to nearly every product in every category. The catchy label rarely means anything specific, just as additional questions are warranted when vendors claim to be “AI-native”. After fighting through all the marketing jargon, there needs to be a standard, not a slogan. And the definition changes depending on what the data is for. AI-ready for a data warehouse and AI-ready for live operational telemetry are not the same problem.

Cribl On Your Coffee Break Episode 2 - Setting up Syslog

In our second video Leon picks on Syslog (because honestly, it deserves it). Cribl is the perfect tool to whip that disorganized, loud, unruly mess of a data stream into shape. By the time the month is over, you will have a pretty good idea of what Cribl can do, and how to do it. You’ll also have consumed more caffeinated beverages than is strictly appropriate...
