The latest News and Information on DevOps, CI/CD, Automation and related technologies.
Five worthy reads is a regular column on five noteworthy items we’ve discovered while researching trending and timeless topics. This week, we delve into the increasing adoption of XaaS models across enterprises to achieve agility, pervasive automation, and digitization of business verticals.
If you run Microsoft’s Hyper-V as your virtualisation platform rather than the ever popular VMware ESX then you probably want a way to manage your Hyper-V hosts as well as the virtual machines that reside on this. Well you can do a lot of the functions that SCVMM does with the free tool for managing Hyper-V, the Hyper-V Manager (which comes as part of the Windows Operating System). System Centre Virtual Machine Manager is also called System Centre VMM or SCVMM for short.
We live in a containerized world, and traditional monitoring and logging are being forever changed. The dynamic and ephemeral nature of containers creates new logging challenges. Docker addresses these in some ways. Docker Engine provides various logging drivers that determine where logs are sent or written to. The default driver for Docker logs is “json-file,” which writes the logs to local files on the Docker host in json format.
Kubernetes has fundamentally changed the way we manage our production environments. The ability to quickly bring up infrastructure on demand is a beautiful thing, but along with it brings some complexity, especially when it comes to logging. Logging is always an important part of maintaining a solid running infrastructure, but even more so with Kubernetes. Because Kubernetes clusters are constantly being spun up, spun down, always in flux, making sure logging functions correctly is critical.
In the past I’ve written about how to use informers in Kubernetes for particular resources, but what if you need to be able to receive events for any Kubernetes resource dynamically? Well, there’s a client-go package for that too. At FireHydrant, we recently updated our Kubernetes integration to watch changes for any resource you configure and I wanted to write down how we made it at a high level.
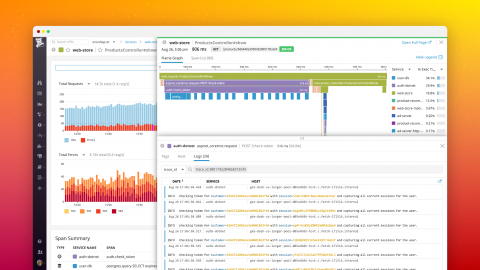
Collecting observability data like metrics, traces, and logs makes it much easier to identify bottlenecks and other performance problems in your .NET applications. When you need to troubleshoot a production incident, it’s especially important to be able to navigate all that data so you can find the source of the issue and enact a timely resolution.