Dashboards
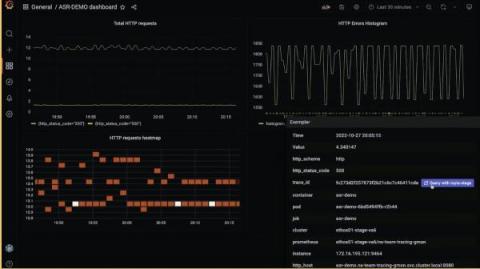
Reduce mean time to hello world with OpenTelemetry, Grafana Mimir, Grafana Tempo, and Grafana: Inside Adobe's observability stack
How is Grafana like an invisibility cloak? At Adobe, it’s one of just four tools they’re using to build observability directly into their CI/CD pipeline, making it essentially invisible — but nonetheless impactful — to thousands of developers across the organization who use it in their day-to-day lives.
Azure Managed Grafana users can now upgrade to Grafana Enterprise
In November 2021, we announced a strategic partnership with Microsoft to develop a Microsoft Azure managed service that lets customers run Grafana natively within their Azure cloud platform. Azure Managed Grafana, which became generally available in August 2022, makes it simple for Azure customers to deploy secure and scalable Grafana instances and connect to open source, cloud, and third-party data sources for visualization and analysis.
4 New AWS Monitoring Dashboards for EC2, EBS, RDS and S3
This is just a quick blog to draw attention to some new and enhanced monitoring dashboards we have added to eG Enterprise in the upcoming release (v 7.2) to provide quick and powerful overviews of a range of AWS services. As with all our dashboards, color-coded overlays provide guided drilldown for help desk operators and administrators. If a component has an issue, an amber or red indicator is overlaid to allow the viewer to click through to further diagnostic information.
Watch: 5 tips for improving Grafana Loki query performance
Grafana Loki is designed to be cost effective and easy to operate for DevOps and SRE teams, but running queries in Loki can be confusing for those who are new to it. Loki is a horizontally scalable, highly available, multi-tenant log aggregation system inspired by Prometheus. It doesn’t index the content of the logs, but rather a set of labels for each log stream.
New Year's (observability) Resolutions
A new year has started and I've been pondering my hopes and dreams for the year to come. In the world of SRE, observability is the most prominent pillar of my work. So, I decided to drill into the topic of observability and what I'd like to see happen in the industry in 2023. Rather than focusing on any tool, technology, or methodology, I'lll be exploring concepts that can be broadly applied in any organization.
Transform the Microsoft Teams Call Quality Dashboard into Monitoring Insights.
Looking for easy Microsoft Teams troubleshooting? Martello's got your back: https://martellotech.com/solutions/microsoft-teams-issues-monitoring/
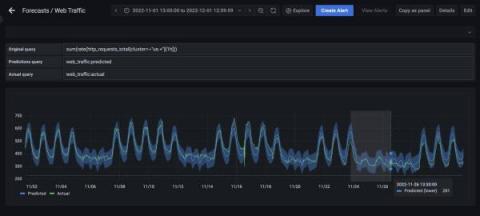
How to forecast holiday data with Grafana Machine Learning in Grafana Cloud
A little over a year ago, we released Grafana Machine Learning, enabling Grafana Cloud Pro and Advanced users to easily view forecasts of their time series. We recently enhanced Grafana Machine Learning with Outlier Detection, which allows you to monitor a group of similar things, such as load-balanced pods in Kubernetes, and get alerted when something starts behaving differently than its peers.
Spot Eco: Introducing a faster, more flexible dashboard
Slight Reliability joins SquaredUp!
We are thrilled to kick start 2023 with an exciting announcement: Slight Reliability is now a part of SquaredUp! Keep reading to learn how this partnership began, in an exclusive interview snippet with our CEO Richard Benwell and Slight Reliability host Stephen Townshend.

