Dashboards

Best Practices for Our Custom Dashboards

Custom dashboards are essential tools in the data-driven world for businesses, organizations, and individuals. They provide an interactive and comprehensive representation of data, making it easier to identify trends, patterns, and outliers. Custom dashboards are highly customizable, allowing users to select the most relevant data sources, visualizations, and metrics to meet their specific needs.

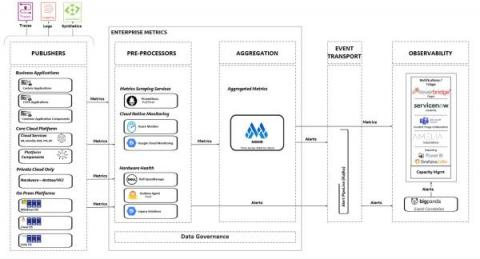
How Wells Fargo modernized its observability stack with Grafana Enterprise and Grafana Cloud

Think of a monitoring tool — any monitoring tool. Got it? Good. Odds are, whatever came to mind was probably being used behind the scenes at Wells Fargo not too long ago. “You name it, and we probably had it at Wells Fargo,” said Senior Software Engineering Manager Nikhilesh Tekwani of the complex web of observability solutions that stretched across the U.S.-based financial institution.

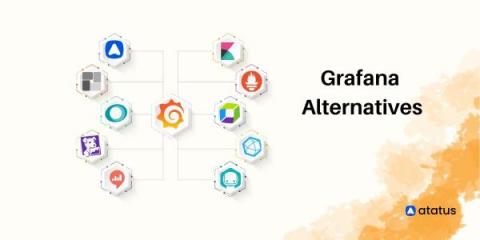
10 Best Grafana Alternatives

Grafana is a powerful open-source data visualization platform created by Torkel Ödegaard in 2014. With its front-end written in Typescript and a Golang back-end, this data monitoring platform allows users to create and share interactive and dynamic dashboards with custom charts and panels using data from various sources, including InfluxDB, Prometheus, Elasticsearch, and many others. Template variables are also available as dropdown options to create dynamic and reusable dashboards.

How to Create a Dashboard in Kibana

Wondering how to create a dashboard in Kibana to visualize and analyze your log data? In this blog post, we’ll provide a step-by-step explanation of how to create a dashboard in Kibana. You’ll learn how to use Kibana to query indexed application and event log data, filter query results to highlight the most critical and actionable information, build Kibana visualizations using your log data, and incorporate those visualizations into a Kibana dashboard.

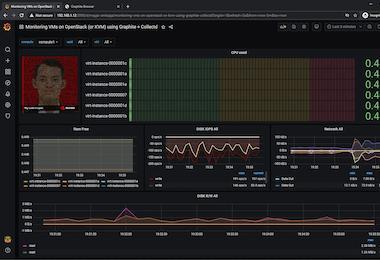
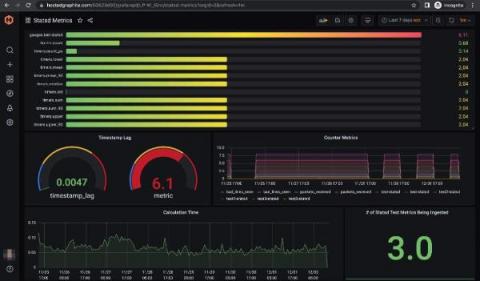
The Best Graphite Dashboard Examples

Graphite provides time-series metrics in an open-source database. With Graphite dashboards, you can see key performance indicators (KPIs) as well as other metrics visually. Dashboards typically display data as graphs, charts, and tables and can be customized to meet the specific needs of an organization. Using dashboards, organizations can monitor and analyze various aspects of their performance, such as system utilization, application performance, and resource utilization, using web interfaces.

Why Clearco switched to Grafana Alerting, Grafana OnCall, and Grafana Incident

Working with technology means dealing with incidents or outages from time-to-time, so staying on top of problems is essential. Back in the spring of 2022, Clearco, the world’s largest e-commerce investor, had an alerting system set up to catch issues, except they had one problem: Clearco’s Customer Success team would learn of a problem before a notification even went off.

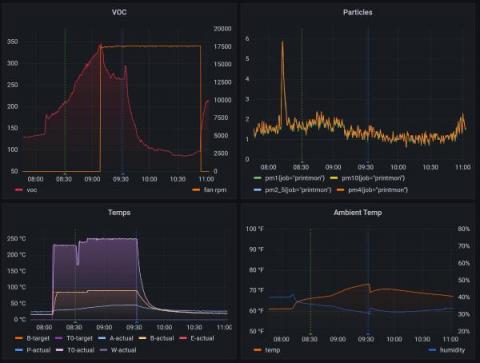
Breathing easy with Grafana dashboards and 3D printing

I lead the Grafana Loki project here at Grafana Labs, and I’ve always loved building things professionally and in my personal life, whether we’re talking about metalworking or coding — or, more recently, 3D printing. A couple years ago, I purchased my first 3D printer, a Prusa i3 MK3S+. I use it periodically to build functional items I use around my house in Upstate New York. For example, I recently decided to build a solar radiation shield for my outdoor weather station.