Dashboards

The Best OpenSearch Dashboard Examples

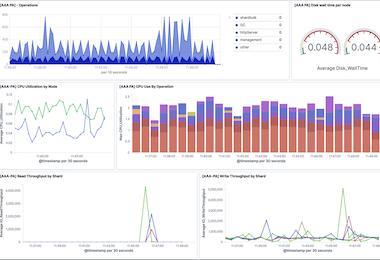
OpenSearch dashboards are a powerful tool for visualising and exploring data stored in an OpenSearch-compatible data store such as Elasticsearch. With OpenSearch's intuitive interface and advanced analytical tools, this visualisation tool makes it easy to gain insights into your data and monitor and alert upon key metrics. Throughout this article, we'll look at some of the most impressive OpenSearch dashboard examples that showcase it’s capabilities and versatility.

Load testing Grafana k6: Peak, spike, and soak tests

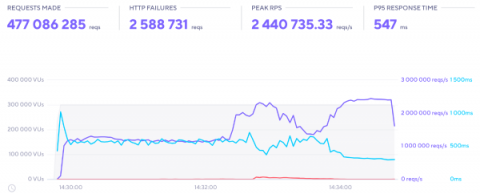
With k6 Cloud, Grafana Labs is in the business of generating load — lots of load, distributed across a cluster of computers. So while our customers care about the systems they load, we care that our system can generate the load that they need and process the test metrics for them in an intuitive, explorable way.

Predictions: AI and Automation

Artificial Intelligence (AI) - or more specifically Machine Learning (ML) - and automation were big topics for many of our customers in 2022. Common reasons for the interest in AI and automation were to: increase efficiency, reduce manual processing, minimise human error and - especially for the use of ML - identify ‘unknown unknowns’.

Visualize real-time mobile app data with the Embrace data source plugin for Grafana

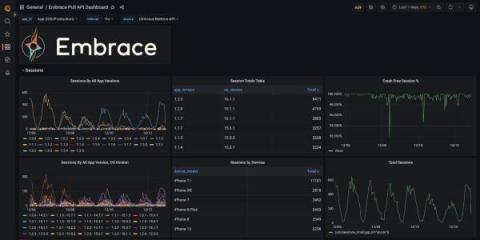
Customers choose Embrace to help mobile development teams build fantastic mobile app experiences. Embrace provides best-in-class mobile insights that help users prioritize, understand, and resolve issues. All of which leads to better development decisions. But in modern software engineering, no team exists in a vacuum.

Watch: How to pair Grafana Faro and Grafana k6 for frontend observability

Grafana Faro and xk6-browser are both new tools within the Grafana Labs open source ecosystem, but the pairing is already showing a lot of potential in terms of frontend monitoring and performance testing. Faro, which was announced last November, includes a highly configurable SDK that instruments web apps to capture observability signals that can then be correlated with backend and infrastructure data.

Correlate Metrics, Traces, & Logs in a Single View With Circonus Unified Dashboards

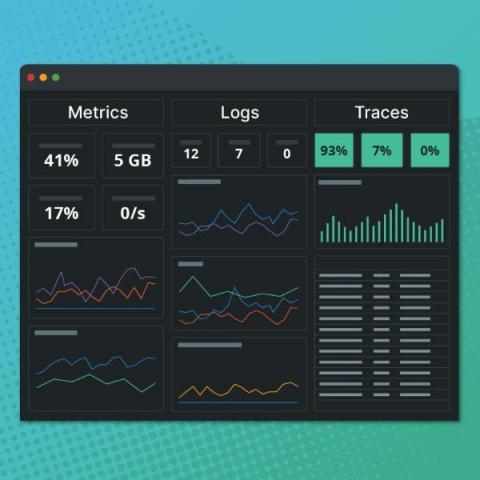
× As organizations shift to service-centric environments, they are generating substantially more data. This in turn has placed strains on monitoring and observability teams, who now must sift through an abundance of data in order to identify and resolve issues — a challenge exacerbated by the number of various monitoring tools they’ve implemented over the years.

Inside ObservabilityCon: 'I picked up so much practical information'

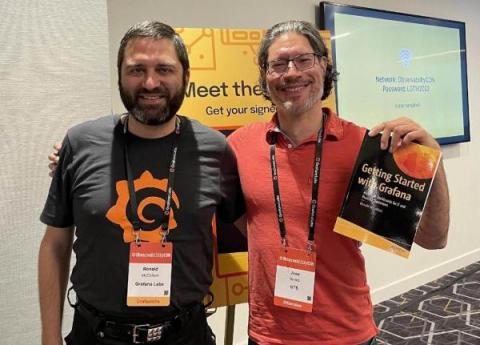
I’ve always been wary about vendor events. In my experience, many of them are mostly marketing pitches, with little or no content that is applicable to my use cases. Despite that, last year I decided to convince my manager to let me attend ObservabilityCON 2022 to see what I could learn from it. My hope was that I would be able to get practical knowledge that could be applied as soon as I got back to work. (Spoiler alert: I did!)

How we reduced flaky tests using Grafana, Prometheus, Grafana Loki, and Drone CI

Flaky tests are a problem that are found in almost every codebase. By definition, a flaky test is a test that both succeeds and fails without any changes to the code. For example, a flaky test may pass when someone runs it locally, but then fails on continuous integration (CI). Another example is that a flaky test may pass on CI, but when someone pushes a commit that hasn’t touched anything related to the flaky test, the test then fails.

Get to know TraceQL: A powerful new query language for distributed tracing

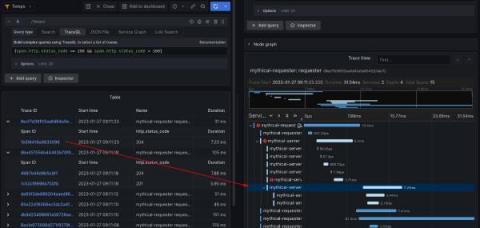
At Grafana Labs, we love tracing, which is why we’ve been hard at work on Grafana Tempo, an open source, highly scalable distributed tracing backend. Tempo just had its 2.0 release. In conjunction with that release, we are excited to show off TraceQL — a powerful new query language designed for distributed tracing. In this blog, we’ll provide an overview of why we created TraceQL, how it works, how you can put it to use today, and what we have planned for future iterations.