Dashboards

Gain real user monitoring insights with Grafana Cloud Frontend Observability

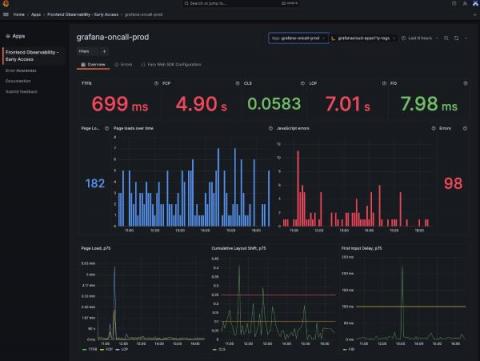
At ObserabilityCON 2022, we announced a limited private preview program for Grafana Cloud Frontend Observability, our hosted service for real user monitoring. Today we are excited to introduce a public preview program that makes Frontend Observability accessible to all Grafana Cloud users, including those in our generous free-forever tier. Simply look for Frontend under Apps in the left-hand navigation of the Grafana Cloud UI and click through to set up the feature. (Not a Grafana Cloud user?

Feature Spotlight: Dynamic Kubernetes Observability Dashboards

If you're a software engineer working with Kubernetes, you know how vital it is to have accurate, real-time information about your applications and resources. With StackState's dynamic Kubernetes observability dashboards, you can now access all the essential data you need for troubleshooting on a single screen. In this blog post, we'll discuss the key features of these dashboards, why they're valuable and how to get started with them.

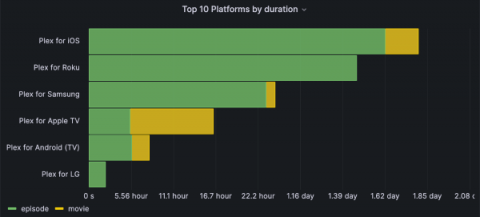
Plexporters, Energize: How we monitor Plex with Grafana

As a Grafanista, you tend to find things to visualize — databases, microservices, classic video games, etc. It’s part of our “big tent” philosophy. So when our December hackathon rolled around, some of us in our internal homelab Slack channel decided to take a look at how we could get metrics out of our Plex Media Servers.

Grafana k6 v0.44.0 release: web crypto API, Web Vitals metrics, and more!

Grafana k6 v0.44.0 has been released, featuring new experimental modules, an upgraded browser module, and tons of improvements. Get Grafana k6 0.44.0 Here’s a quick overview of the latest k6 news from the team and the community.

Grafana 9.5 release: Grafana Alerting updates, stronger security with service accounts, upgraded dashboards, and more

Grafana 9.5 has arrived! 🔥🎉 Get Grafana 9.5 The latest Grafana release introduces new features and improvements, such as major Grafana Alerting improvements, dashboard and visualization enhancements, a redesigned navigation experience, support bundles for faster issue resolution, and much more to provide you with better insights into your data.

Multiple players, one stack: Inside Roblox's centralized observability stack

When you sign into the Roblox platform, you get 30 million immersive experiences, ranging from concerts to fashion shows to, of course, video games. But when the observability team at Roblox logs on, they’re not playing around. The Roblox observability engineers are responsible for keeping more than 214 million monthly users happy and engaged by making the wildly popular gaming platform highly available around the world.

Supercharging Grafana with the Power of Telemetry Pipelines

Grafana is a popular open-source tool for visualizing and analyzing data from various sources. It provides a platform for creating interactive, customizable dashboards that display real-time data in various formats, including graphs, tables, and alerts. When powered by Mezmo's Telemetry Pipeline, Grafana can access a wide range of data sources and provide a unified view of the performance and behavior of complex systems.