Dashboards
The Legacy Dashboard is levelling up
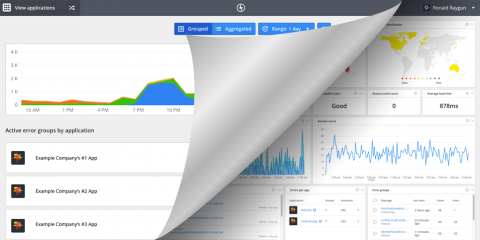
Last April, we launched a new feature called Custom Dashboards allowing teams to sort and view data from Raygun Crash Reporting, Real User Monitoring, and Application Performance Management. It was built as an upgrade to our Legacy Dashboard, offering better visualization, customization, and navigation.
timeShift(GrafanaBuzz, 1w) Issue 49
This week’s roundup highlights videos from Monitorama, making your own Grafana Plugins, NetApp’s fully open source monitoring stack and more.
timeShift(GrafanaBuzz, 1w) Issue 48
We were in Portland this week attending Monitorama - one of our favorite annual conferences. We got the chance to catch up with old friends, make some new ones, and be part of an amazing community of passionate data and monitoring aficionados. Looking forward to Monitorama AMS in September! Also this week we released Grafana v5.2.0-beta1 and… Elasticsearch alerting has arrived! Download it today and let us know what you think. Check out the specifics on the beta release below.
Grafana vs. Kibana: The Key Differences to Know
We live in a world of big data, where even small-sized IT environments are generating vast amounts of data. Once an organization has figured out how to tap into the various data sources generating the data, and the method for collecting, processing and storing it, the next step is analysis.
timeShift(GrafanaBuzz, 1w) Issue 47
We cover a lot of ground this week with posts on general monitoring principles, home automation, how CERN uses open source projects in their particle acceleration work, and more.
Monitoring with Azure and Grafana
What is whitebox monitoring? Why do we monitor our systems? What is the Azure Monitor plugin and how can I use it to monitor my Azure resources? Recently, I spoke at Swetugg 2018, a .NET conference held in Stockholm, Sweden to answer these questions. In this video you’ll learn some basic monitoring principles, some of the tools we use to monitor our systems, and get an inside look at the new Azure Monitor plugin for Grafana.
timeShift(GrafanaBuzz, 1w) Issue 46
The day has finally arrived; GDPR is officially in effect! These new policies are meant to provide more transparency about the data companies collect on users, and how that data is used. I for one am just excited that the onslaught of "We’ve updated our privacy policy" emails arriving in my pummeled inbox is nearing its end.
Integrating Logz.io with Grafana
While Logz.io provides Kibana — the ELK Stack’s visualization tool — as part of its service, a lot of users have asked us to support Grafana. One of the leading open source visualization tools today, Grafana has some added value when compared to Kibana, especially around visualizing time-series data.
timeShift(GrafanaBuzz, 1w) Issue 45
In addition to our weekly roundup of Grafana-related articles and upcoming events, we’re pleased to announce Grafana v5.1.3 has been released!


